INFLATION IN INDIA: TYPES, CAUSES, CPI VS WPI MEASUREMENT, MACROECONOMIC IMPACTS & CONTROL MEASURES (COMPLETE GUIDANCE FOR COMPETITIVE EXAMS)
Chapter 1
INTRODUCTION
Inflation is one of the most fundamental concepts in macroeconomics and public policy. Defined as a sustained, broad-based increase in the general price level of goods and services in an economy over a specified period of time, inflation directly impacts the daily lives of citizens by eroding the purchasing power of money. When inflation occurs, a single unit of currency buys a smaller percentage of a good or service than it did previously.
In an emerging market economy like India, maintaining a moderate, predictable rate of inflation is essential. While hyperinflation destroys consumer savings and distorts investment planning, severe deflation (falling prices) leads to economic stagnation, wage cuts, and business failures. Therefore, the Reserve Bank of India (RBI) and the Government of India operate a coordinated policy framework to keep inflation anchored within a healthy target range—specifically 4% Consumer Price Index (CPI) inflation with an allowable tolerance band of 2% to 6%.
Understanding inflation requires analyzing its root causes—whether driven by excess monetary demand (Demand-Pull Inflation), rising input supply costs (Cost-Push Inflation), global commodity price shocks (Imported Inflation), or structural distribution bottlenecks.
For aspirants preparing for competitive examinations such as UPSC Civil Services (GS Paper III Economics), Banking Exams (IBPS PO, SBI PO, RBI Grade B), State PSCs, and SSC CGL, a thorough mastery of inflation classifications, CPI vs WPI differences, GDP Deflator, Core vs Headline inflation, Phillips Curve, and monetary/fiscal control measures is essential.
This comprehensive master career guide provides an exhaustive breakdown of Inflation in India. We cover every economic detail—from 8 inflation types and measurement index comparison tables to NSO CPI weightages, Phillips Curve dynamics, monetary and fiscal remedies, 12 exam-focused FAQs, and essential revision tools.
---
- The Inflation Tax: Because inflation erodes the real value of cash balances, holding uninvested money acts like paying a tax to the economy.
- Redistribution of Wealth: Inflation benefits debtors (borrowers) at the expense of creditors (lenders) because borrowers repay loans with money that has less purchasing power than when borrowed.
Chapter 2
DEFINITION AND PURCHASING POWER OF MONEY
DEFINITION AND PURCHASING POWER OF MONEY - Illustrative Reference
$$\text{Value of Money } (V) = \frac{1}{\text{Price Level } (P)}$$
General Price Level Rises (Inflation)
       │
       ▼
Purchasing Power of Rupee Declines
       │
       ▼
100 Rupees Buys Fewer Kilograms of Food / Goods Than Before
It is crucial to distinguish between a temporary increase in the price of a single commodity (such as a seasonal spike in tomato or onion prices due to weather) and true inflation. True inflation is a persistent, generalized price rise across a representative basket of consumer goods and services across the entire economy.
---
Chapter 3
CLASSIFICATION OF INFLATION BY CAUSE
Types of Inflation by Cause
├── 1. Demand-Pull Inflation ("Too much money chasing too few goods")
├── 2. Cost-Push Inflation ("Rising production input costs driving prices up")
├── 3. Structural / Built-in Inflation ("Wage-Price Spirals & supply bottlenecks")
└── 4. Imported Inflation ("Global commodity shocks & currency depreciation")
---
Chapter 4
# 1. DEMAND-PULL INFLATION
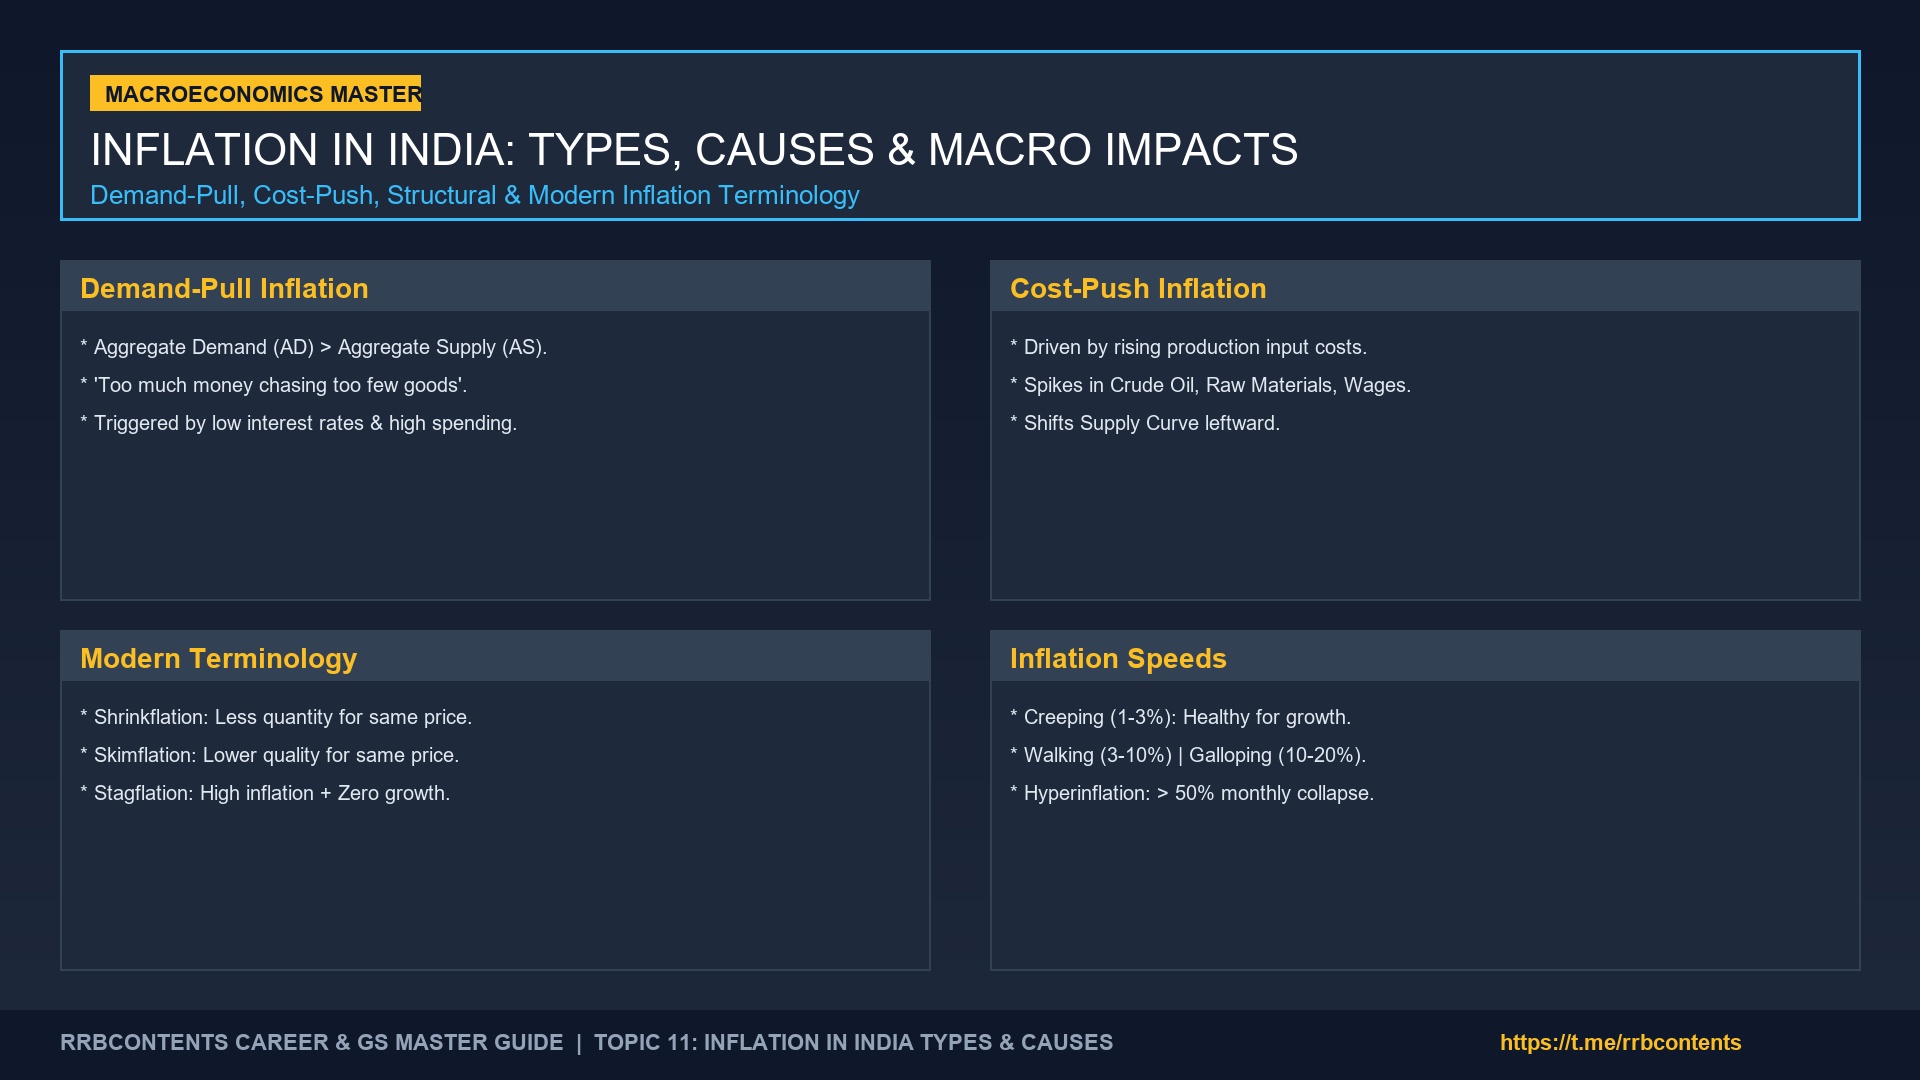
Demand-Pull inflation occurs when total aggregate demand ($AD$) for goods and services in an economy exceeds the total aggregate supply ($AS$) at existing prices ($AD > AS$).
Aggregate Demand (AD) > Aggregate Supply (AS)
       │
       ▼
Suppliers Increase Prices to Ration Limited Stock
       │
       ▼
Demand-Pull Inflation Triggered
1. Expansionary Monetary Policy: Low interest rates and excessive money supply growth by central bank.
2. Expansionary Fiscal Policy: High government welfare spending, tax cuts, and deficit financing.
3. Rapid Population & Income Growth: Rising household disposable incomes driving consumer demand.
4. Strong Export Demand: High foreign demand draining domestic product supply.
---
Chapter 5
# 2. COST-PUSH INFLATION
Cost-Push inflation occurs when aggregate supply ($AS$) contracts due to an increase in the cost of production inputs, forcing producers to raise retail prices to maintain profit margins.
Increase in Input Costs (Raw Materials, Crude Oil, Wages, Taxes)
       │
       ▼
Production Cost Per Unit Rises
       │
       ▼
Producers Shift Supply Curve Leftward & Increase Retail Prices
1. Global Crude Oil Shocks: Spikes in international crude oil prices increase domestic transportation and manufacturing costs.
2. Wage-Push Inflation: Trade unions demanding wage increases exceeding labor productivity growth.
3. Indirect Tax Hikes: Increase in GST or excise duties on essential inputs like diesel.
4. Natural Disasters & Supply Chain Disruptions: Droughts, floods, or geopolitical wars disrupting crop production and supply chains.
---
Chapter 6
# 3. STRUCTURAL & BUILT-IN INFLATION
- Built-in / Wage-Price Spiral: Occurs when workers demand higher wages to keep up with rising living costs, and businesses raise product prices to cover higher wage costs, creating a continuous upward spiral ($\text{Higher Wages} \rightarrow \text{Higher Prices} \rightarrow \text{Higher Wages}$).
- Structural Inflation: Prevalent in developing nations like India due to structural bottlenecks—such as inadequate cold storage facilities, agricultural marketing inefficiencies, hoarding, and transportation bottlenecks.
---
Chapter 7
# 4. IMPORTED INFLATION
Occurs when a country imports essential commodities (such as crude oil, edible oils, electronics, and fertilizers) at elevated international prices, or when the domestic currency (Indian Rupee) depreciates significantly against the US Dollar.
$$\text{Depreciating Rupee } (\text{INR} \downarrow) \quad \rightarrow \quad \text{Costlier Imports in Rupee Terms} \quad \rightarrow \quad \text{Imported Inflation}$$
---
Chapter 8
CLASSIFICATION OF INFLATION BY RATE / SPEED
Speed-Based Inflation Spectrum
├── 1. Creeping Inflation (1% - 3% per annum): Healthy & manageable
├── 2. Walking / Trotting Inflation (3% - 10% per annum): Warning signal for central bank
├── 3. Galloping / Running Inflation (10% - 20%+ per annum): Severe economic distress
└── 4. Hyperinflation (Out of control 50%+ monthly): Currency collapse
| Inflation Category | Annual Rate Range | Economic Characteristics & Impact |
|---|---|---|
| Creeping Inflation | 1% to 3% | Mild and gradual price rise. Considered healthy for economic growth as it encourages investment. |
| Walking / Trotting | 3% to 10% | Moderate inflation. Single-digit inflation that signals central banks to tighten monetary policy. |
| Galloping / Running | 10% to 20%+ | Double-digit inflation causing significant loss of purchasing power and currency instability. |
| Hyperinflation | Exceeding 50% Monthly | Extreme, catastrophic price rise. Currency becomes worthless (e.g. Weimar Germany 1923, Zimbabwe 2008, Venezuela 2018). |
---
1. Agflation (Agricultural Inflation): A rapid, targeted price rise in agricultural commodities (grains, oilseeds, sugar) caused by crop failures, droughts, or expanding global biofuel demand. In India, agflation directly impacts low-income households where food consumes over 50% of monthly budgets.
2. Reflation: A deliberate fiscal or monetary policy stimulus initiated by the government or central bank to revive an economy suffering from deflationary slump. Reflation boosts demand through tax cuts, public infrastructure investments, and interest rate reductions.
3. Deflationary Spiral: A dangerous vicious economic cycle where falling prices lead consumers to delay purchases, causing businesses to cut production and lay off workers, which further depresses aggregate demand and drives prices down even lower.
Chapter 9
MODERN INFLATION CONCEPTS (NEW EXAM TERMINOLOGY)
1. Shrinkflation: The practice of reducing a product's package size or quantity while keeping its retail price unchanged (e.g. reducing a biscuit packet weight from 100g to 80g for ₹10).
2. Skimflation: Reducing the quality or service level of a product while maintaining its original retail price (e.g. substituting high-quality ingredients with cheaper fillers).
3. Stagflation: A toxic economic condition characterized by stagnant economic growth, high unemployment, and persistent high inflation simultaneously.
4. Greedflation: Corporate profit margin expansion driving retail price hikes beyond actual input cost increases during supply shocks.
5. Disinflation: A temporary slowing down of the rate of inflation (e.g. inflation dropping from 7% to 4%). (Note: Disinflation is NOT deflation; prices are still rising, but at a slower rate).
---
Chapter 10
MEASUREMENT OF INFLATION IN INDIA: CPI VS WPI VS GDP DEFLATOR
Primary Price Indices in India
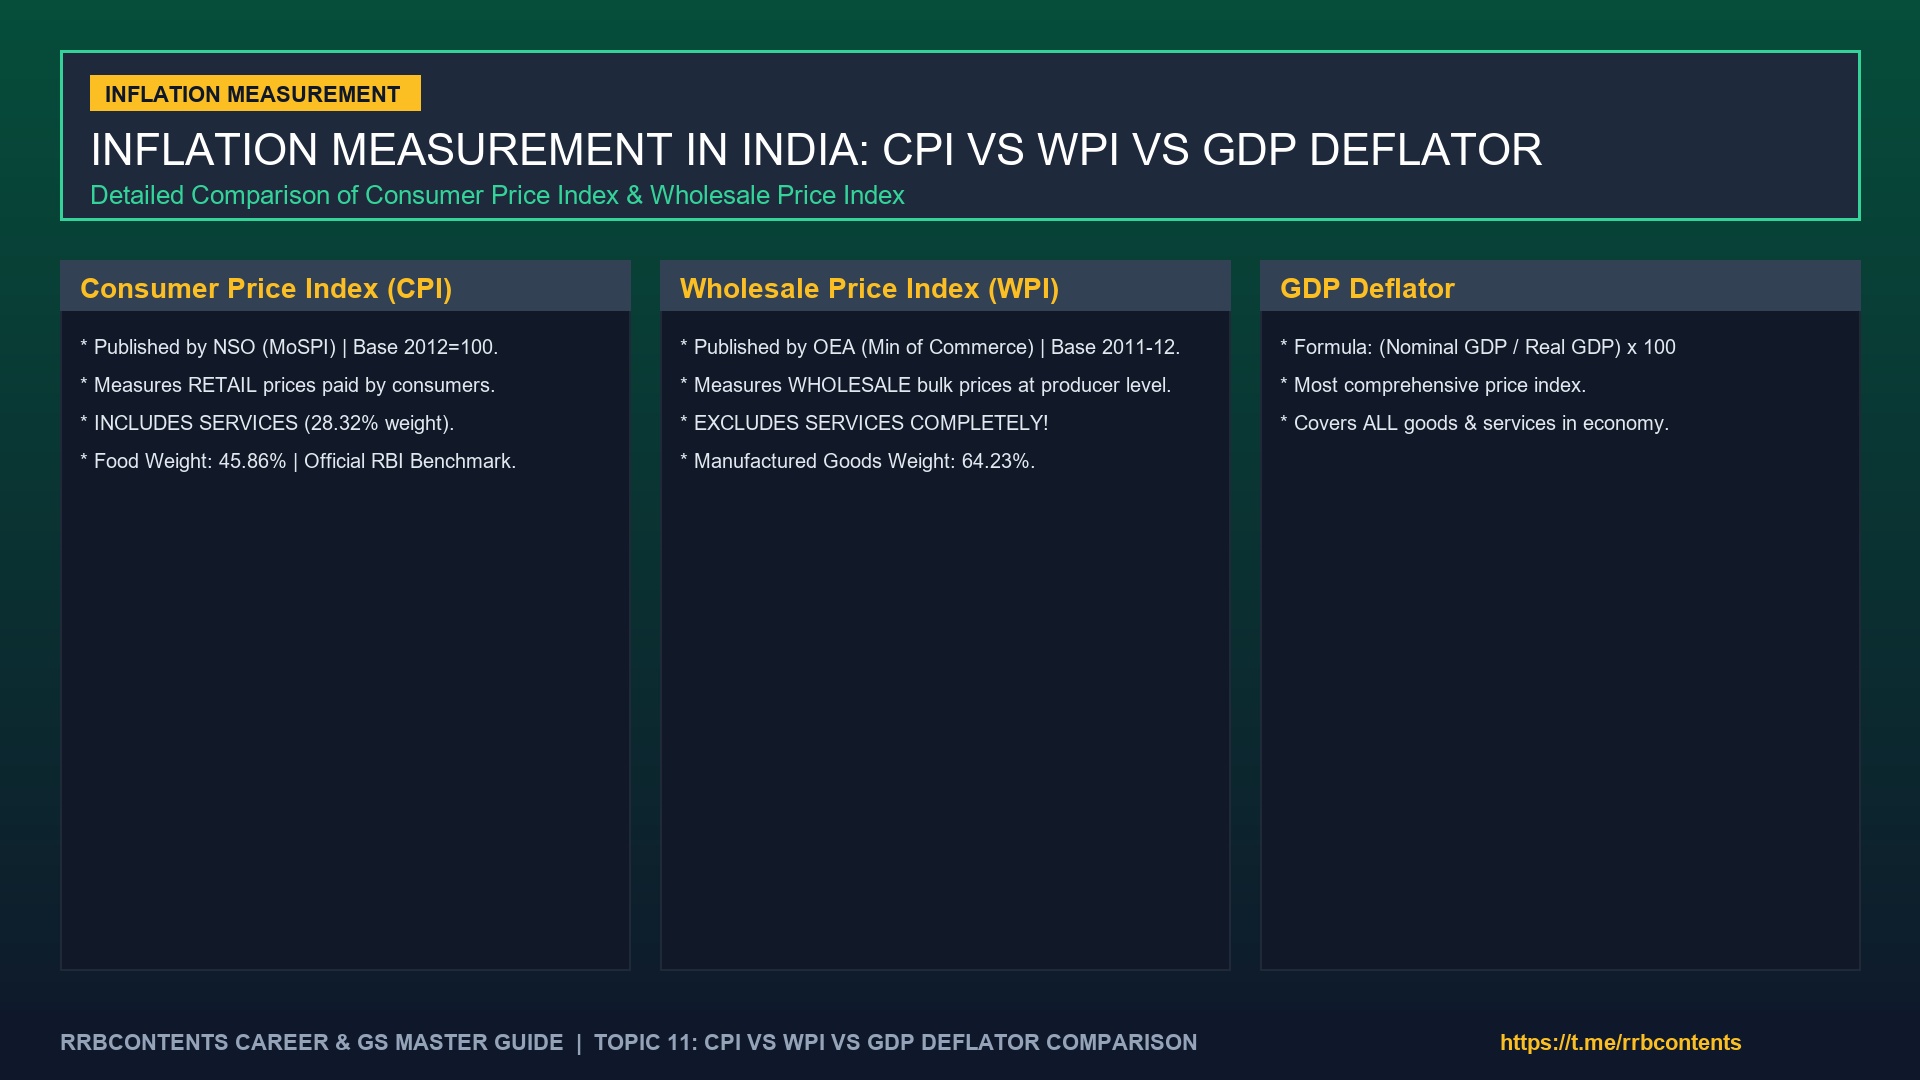
├── 1. Consumer Price Index (CPI): Measures retail prices paid by end consumers | NSO | Base 2012=100
├── 2. Wholesale Price Index (WPI): Measures bulk prices at producer level | OEA (Ministry of Commerce) | Base 2011-12=100
└── 3. GDP Deflator: Ratio of Nominal to Real GDP | Most comprehensive index
---
- Engel's Law Application: According to Engel's Law, lower-income households spend a larger proportion of their total income on basic food items. In India, food accounts for nearly 50% of rural household budgets and 36% of urban household budgets.
- Monetary Policy Dilemma: Because food prices are driven primarily by weather monsoons and global supply shocks, raising Repo Rates cannot immediately produce more rain or tomatoes. This creates a policy dilemma for the Monetary Policy Committee (MPC) when dealing with food-driven headline inflation spikes.
- Published By: National Statistical Office (NSO), Ministry of Statistics and Programme Implementation (MoSPI).
- Frequency: Monthly.
- Base Year: 2012 = 100.
- Primary Scope: Measures retail price changes of a representative basket of goods and services consumed by rural and urban households.
- Used By RBI: CPI Combined is the official benchmark index used by RBI for Monetary Policy inflation targeting (4% +/- 2%).
| CPI Category | Publishing Agency | Base Year | Key Practical Usage |
|---|---|---|---|
| CPI (Combined - Rural+Urban) | NSO (MoSPI) | 2012=100 | Primary benchmark for RBI Monetary Policy. |
| CPI for Industrial Workers (CPI-IW) | Labour Bureau (Ministry of Labour) | 2016=100 | Used for calculating Dearness Allowance (DA) for Central Govt employees. |
| CPI for Agricultural Labourers (CPI-AL) | Labour Bureau | 1986-87=100 | Used for fixing Minimum Wages in agriculture. |
| CPI for Rural Labourers (CPI-RL) | Labour Bureau | 1986-87=100 | Tracks living costs of rural landless workers. |
1. Food and Beverages: 45.86% (Highest weightage - makes CPI sensitive to food prices).
2. Housing: 10.07% (Urban only).
3. Fuel and Light: 6.84%.
4. Clothing and Footwear: 6.53%.
---
The Ministry of Commerce operates a technical working group to revise the WPI base year from 2011-12=100 to 2017-18=100, expanding the item basket to include new manufactured goods and modern industrial inputs.
- Published By: Office of Economic Adviser (OEA), Department for Promotion of Industry and Internal Trade (DPIIT), Ministry of Commerce and Industry.
- Frequency: Monthly.
- Base Year: 2011–12 = 100.
- Primary Scope: Tracks price movements of goods traded at the wholesale / producer level in bulk.
- Crucial Exam Distinction: WPI does NOT include SERVICES! It tracks physical commodities only.
1. Manufactured Products: 64.23% (Highest weightage - 555 items).
2. Primary Articles: 22.62% (Food articles, non-food minerals - 117 items).
3. Fuel and Power: 13.15% (LPG, Petrol, Diesel, Electricity - 25 items).
---
| Feature / Dimension | Consumer Price Index (CPI) | Wholesale Price Index (WPI) |
|---|---|---|
| Publishing Agency | NSO (MoSPI) | Office of Economic Adviser (Min of Commerce) |
| Base Year | 2012 = 100 | 2011–12 = 100 |
| Point of Measurement | Retail level (End Consumer) | Wholesale / Producer level (Bulk) |
| Includes Services? | YES (Education, Health, Transport - 28.32%) | NO (Physical Goods Only) |
| Food Weightage | High (45.86%) | Moderate (24.38% combined) |
| Primary Item Weightage | Food & Beverages (45.86%) | Manufactured Products (64.23%) |
| Policy Application | Used by RBI for Monetary Policy (4%) | Used by industry for cost contract indexing |
---
Chapter 11
# 4. GDP DEFLATOR
The GDP Deflator is the ratio of Nominal GDP to Real GDP, serving as the most comprehensive measure of inflation because it covers ALL goods and services produced in the entire economy:
$$\text{GDP Deflator} = \left( \frac{\text{Nominal GDP}}{\text{Real GDP}} \right) \times 100$$
- Advantage over CPI/WPI: Not restricted to a fixed basket of goods; automatically adjusts to changing consumption patterns.
- Disadvantage: Published only quarterly/annually alongside GDP data, so cannot be used for monthly RBI policy decisions.
---
Chapter 12
CORE INFLATION VS HEADLINE INFLATION
Inflation Metrics
├── Headline Inflation: Total CPI Inflation including volatile Food and Fuel components
└── Core Inflation: Headline Inflation MINUS volatile Food and Fuel items
$$\text{Core Inflation} = \text{Headline CPI Inflation} - (\text{Food Inflation} + \text{Fuel Inflation})$$
- Why Core Inflation Matters: Food and energy prices fluctuate rapidly due to weather or OPEC shocks. Core inflation isolates underlying demand-driven price trends, providing central banks with a clearer picture of structural inflation.
---
Chapter 13
THE PHILLIPS CURVE & BASE EFFECT
$$\text{Higher Inflation Rate } (\pi \uparrow) \quad \iff \quad \text{Lower Unemployment Rate } (U \downarrow)$$
Short-Run Phillips Curve (Trade-off)
├── High Aggregate Demand -> Businesses Hire More Workers -> Unemployment Falls
└── Labor Shortage -> Wages Rise -> Prices Rise -> Inflation Increases
- Long-Run Phillips Curve (Monetarists / Milton Friedman): In the long run, there is NO trade-off between inflation and unemployment. The long-run Phillips Curve is a vertical line at the Natural Rate of Unemployment (NAIRU).
The Base Effect refers to the impact of the price level in the corresponding period of the previous year (the base) on the calculation of the current inflation rate:
- If prices were abnormally low in the base month last year, even a small price rise this year will show up as a high percentage inflation rate.
- If prices were abnormally high in the base month last year, current inflation will appear low due to a high base.
---
Chapter 14
# Trade Policy Instruments for Inflation Control: Minimum Export Prices & Tariff Quotas:
1. Minimum Export Price (MEP): Fixing a floor price below which exporters cannot sell agricultural products abroad (e.g. $800/tonne MEP on onions), discouraging exports and forcing traders to sell domestically.
2. Tariff Rate Quotas (TRQ): Permitting zero-duty imports of specified quantities of crude sunflower oil, soybean oil, and maize to suppress domestic retail prices during international price spikes.
Chapter 15
CONTROL MEASURES TO CURB INFLATION IN INDIA
Inflation Control Strategy
├── 1. Monetary Policy Measures (RBI) -> Increase Repo, CRR, SDF; absorb excess liquidity
├── 2. Fiscal Policy Measures (Govt) -> Reduce excise duties on fuel, cut non-essential spending
└── 3. Administrative / Trade Measures -> Impose export duties, stock limits under EC Act
- Increase Repo Rate: Raises borrowing costs across commercial banks, suppressing credit growth and consumer demand.
- Increase CRR / SDF: Absorbs excess cash reserves from the banking system.
- Open Market Operations (OMO): Outright sale of G-Secs by RBI to mop up surplus Rupee liquidity.
- Reduction of Excise Duties: Cutting central excise duties on petrol and diesel to lower transportation costs.
- Rationalizing Import Customs Duties: Reducing import duties on essential commodities (edible oils, pulses, steel) to increase domestic supply.
- Restraining Fiscal Deficit: Reducing un-targeted government expenditure to curb excess demand.
Chapter 16
# Agricultural Price Stabilization Mechanisms: Buffer Stock & Price Stabilization Fund (PSF):
To insulate domestic consumers from violent seasonal spikes in essential food commodities, the Ministry of Consumer Affairs, Food and Public Distribution operates targeted price defense mechanisms:
- Open Market Sale Scheme (OMSS): Food Corporation of India (FCI) sells surplus wheat and rice from central pool stocks at pre-determined reserve prices via periodic e-auctions to flour millers and bulk buyers, augmenting open market supply.
- Price Stabilization Fund (PSF): Set up in 2014-15, the PSF maintains strategic buffer stocks of pulses (chana, tur, urad) and key vegetables (onions, potatoes) purchased directly from farmers during harvest surplus, releasing them into retail markets during lean seasons.
- Operation Greens (TOP to TOTAL): Implemented under the Ministry of Food Processing Industries, providing 50% transportation and cold storage subsidies for Tomato, Onion, and Potato (TOP) crops to prevent distress sales.
- Essential Commodities Act (EC Act), 1955: Imposing legal stockholding limits on traders and wholesalers to prevent hoarding of pulses, onions, and oilseeds.
- Trade Policy Adjustments: Banning exports or imposing Minimum Export Prices (MEP) on essential items (e.g. non-basmati white rice, onions) to prioritize domestic availability.
- Buffer Stock Releases: Releasing wheat and rice from Food Corporation of India (FCI) buffer stocks into open market via Open Market Sale Scheme (OMSS).
---
- Inflation-Indexed Bonds (IIBs): Debt instruments issued by RBI where both principal and interest payments are linked directly to the CPI index, guaranteeing a real rate of return above inflation.
- Sovereign Gold Bonds (SGBs): Issued by RBI on behalf of GOI, providing 2.5% annual interest while matching domestic gold price appreciation, diverting physical gold demand to paper gold.
Chapter 17
IMPORTANCE FOR COMPETITIVE EXAMS & QUICK REVISION
1. Target Index: CPI Combined (NSO, Base 2012=100) used by RBI for 4% (+/- 2%) inflation targeting.
2. CPI-IW: Published by Labour Bureau (Base 2016=100); used for Dearness Allowance (DA) calculations.
3. WPI Secrets: Published by Office of Economic Adviser (Base 2011-12=100); Excludes Services! Manufactured goods weightage = 64.23%.
4. Deficit Formulas: Core Inflation = Headline CPI minus (Food + Fuel).
---
Chapter 18
FREQUENTLY ASKED QUESTIONS (FAQS)
Chapter 19
# Q1: Which index is officially used by the RBI for monetary policy inflation targeting?
Answer: The Consumer Price Index (CPI Combined) published by the National Statistical Office (NSO) with base year 2012=100.
Chapter 20
# Q2: What is the primary difference between CPI and WPI in India?
Answer: CPI measures retail prices paid by end consumers and includes services (28.32% weight). WPI measures wholesale prices at the producer level and excludes services completely.
Chapter 21
# Q3: Which index is used to calculate Dearness Allowance (DA) for government employees?
Answer: CPI for Industrial Workers (CPI-IW), published monthly by the Labour Bureau (base year 2016=100).
Answer: Demand-Pull inflation occurs when aggregate demand for goods and services exceeds aggregate supply ("too much money chasing too few goods").
Answer: Cost-Push inflation occurs when input production costs (raw materials, crude oil, wages) increase, forcing producers to raise retail prices.
Answer: Core Inflation is calculated by subtracting volatile food and energy/fuel prices from the Headline CPI inflation.
Answer: Stagflation is a economic condition characterized by stagnant economic growth, high unemployment, and high inflation simultaneously.
Answer: Shrinkflation is the commercial practice of reducing a product's size or weight while keeping the retail price unchanged.
Answer: The short-run Phillips Curve illustrates an inverse relationship between inflation and unemployment (higher inflation correlates with lower unemployment).
Answer: $$\text{GDP Deflator} = \left( \frac{\text{Nominal GDP}}{\text{Real GDP}} \right) \times 100$$.
Chapter 22
# Q11: What is the highest weighted component in the CPI Combined basket?
Answer: Food and Beverages, holding a weightage of 45.86%.
Chapter 23
# Q12: What is the highest weighted component in the WPI basket?
Answer: Manufactured Products, holding a weightage of 64.23%.
---
Answer: Agflation refers specifically to a rapid rise in prices of agricultural commodities and food products caused by supply disruptions or bio-fuel demand.
Answer: Established in 2014-15, the PSF funds the procurement and maintenance of strategic buffer stocks of pulses and vegetables (onions, potatoes) to curb market price spikes.
Answer: Reflation is a deliberate government policy aimed at stimulating economic activity and bringing prices back up during a deflationary slowdown.
Answer: MEP is a temporary floor price imposed by the Ministry of Commerce below which agricultural goods cannot be exported, ensuring domestic supply availability during price inflation.
Chapter 24
# Q17: What is Engel's Law in the context of CPI food weightage?
Answer: Engel's Law states that as household income rises, the proportion of income spent on food declines. India's high CPI food weight (45.86%) reflects the significant portion of income lower-income households spend on food.
- Release Schedule: CPI inflation data for a given month is officially released by the NSO on the 12th day of the subsequent month at 5:30 PM.
- Data Collection Network: Field investigators collect price quotes weekly from 1,181 village markets across rural areas and 1,114 urban markets across 310 towns in all States and UTs via handheld tablet devices.
- Provisional vs Final Index: NSO releases a provisional CPI index initially, which is updated to a final index after a 1-month data verification audit.
Chapter 25
TYPES OF INFLATION BY SPEED AND CAUSE
Chapter 26
# 1. By Speed / Rate of Inflation:
- Creeping Inflation: 1% to 3% annually (mild, manageable, beneficial for growth).
- Walking / Trotting Inflation: 3% to 10% annually (warning signal for central bank).
- Running Inflation: 10% to 20% annually (requires immediate monetary intervention).
- Hyperinflation: >50% per month (total loss of currency confidence, e.g. Zimbabwe, Venezuela).
Chapter 27
# 2. By Primary Cause:
- Demand-Pull Inflation: Money supply or aggregate demand outpaces aggregate supply ("too much money chasing too few goods").
- Cost-Push Inflation: Supply shocks, rising raw material or wage costs shift aggregate supply curve leftward.
---
Chapter 28
CONCLUSION
Inflation in India is a multifaceted macroeconomic phenomenon requiring continuous vigilance from both monetary and fiscal authorities. By balancing demand management through RBI's policy rate adjustments with supply-side interventions by the Central Government, India protects the purchasing power of its citizens while maintaining robust economic growth.
Mastering the mechanics of Demand-Pull and Cost-Push drivers, CPI vs WPI measurement differences, Core inflation indicators, and emergency supply interventions equips students and policy analysts to evaluate economic trends effectively.
For competitive exam aspirants, mastering CPI weightages, WPI components, GDP Deflator, Phillips Curve dynamics, and inflation control tools guarantees complete preparation for scoring top marks in Indian Economy.
👉 Official Career Portal: [https://rrbcontents.com](https://rrbcontents.com)
👉 Official Telegram Channel: [Join RRBCONTENTS Telegram (@rrbcontents)](https://t.me/rrbcontents)
---
Chapter 29
Key Inflation Control Instruments — Fiscal Side
While monetary policy through the RBI's Monetary Policy Committee (MPC) is the primary tool for inflation control, India also employs a range of fiscal and administrative instruments to manage price levels — particularly food inflation which has a disproportionate impact on India's poor.
Essential Commodities Act (ECA) 1955:
This Act gives the Central and State governments powers to control production, supply, and distribution of essential commodities. Under it, the government can impose stock limits on essential items like onion, pulses, edible oils, and potatoes to prevent hoarding and artificial price inflation by traders. The ECA Amendment Act 2020 (part of farm reform package) restricted government intervention in agricultural commodities — stock limits can now only be imposed under extraordinary circumstances: when retail price of horticultural crops rises 100% over past 12 months, or non-perishable agricultural food stuffs rise 50%. The 2020 amendment was controversial and later reviewed amid broader farm law protests.
Price Stabilization Fund (PSF):
Managed by NAFED (National Agricultural Cooperative Marketing Federation of India), the PSF is used to procure pulses, oilseeds, and onion during harvest season (when prices are low) to build a buffer stock. This stock is released in lean seasons or when prices spike, moderating retail price inflation. The corpus of the PSF is approximately Rs 1,500 crore. Procurement under PSF has been critical during onion price spikes (2019, 2023) and pulse price surges.
Buffer Stocking Policy (Wheat and Rice):
The Food Corporation of India (FCI) maintains strategic buffer stocks of wheat and rice across the country. The government has prescribed minimum buffer norms — as of recent revisions: Wheat: 21.2 MT (July 1 norm); Rice: 13.5 MT (July 1 norm). When market prices spike, the government releases FCI stocks to cooperative and ration shops or in open market sales (OMSS — Open Market Sale Scheme) to depress prices. This mechanism was critically used during 2022-23 wheat and rice price pressures.
Export Restrictions as an Anti-Inflation Tool:
When domestic food prices rise sharply, the government bans or curtails exports to ensure adequate domestic supply. Recent examples: Onion export ban (December 2023) to control domestic prices; Non-basmati white rice export ban (August 2023) when global El Niño fears pushed rice prices; Wheat export ban (May 2022) amid post-Russia-Ukraine conflict supply disruptions. These measures are temporary but signal the government's willingness to prioritize domestic food security over export earnings.
---
Chapter 30
Wholesale Price Index (WPI) vs Consumer Price Index (CPI) — Detailed Comparison
Both WPI and CPI measure inflation but at different stages of the supply chain and serve different policy purposes. This comparison is frequently tested in UPSC, RRB, and Bank exams:
| Feature | WPI (Wholesale Price Index) | CPI (Consumer Price Index — Combined) |
|---|---|---|
| Released by | Office of the Economic Adviser (OEA), DPIIT, Ministry of Commerce & Industry | MoSPI (Ministry of Statistics & Programme Implementation) |
| Base Year | 2011-12 | 2012 |
| Frequency | Monthly (released ~14th of following month) | Monthly (released ~12th of following month) |
| Used for Monetary Policy? | NO — not used for MPC inflation targeting | YES — MPC targets CPI inflation at 4% (±2%) |
| Number of Commodities | 697 commodities | 299 items |
| Coverage Level | Wholesale/producer level (factory gate, mandis) | Consumer/retail level (what households actually pay) |
| Food & Beverages Weight | ~24.38% | ~45.86% (Food, beverages, tobacco) |
| Services Included? | NO — only goods | YES — includes services like education, health |
| Primary Use | Tracking input cost inflation; deflating GDP data; trade policy | Monetary policy; real wage calculation; COLA adjustments |
Key exam fact: India shifted from WPI-based to CPI-based monetary policy targeting in 2014 following the Urjit Patel Committee recommendations. The Flexible Inflation Targeting (FIT) framework was formalized by the RBI Amendment Act 2016, making 4% CPI (±2%) the official target.
---
Chapter 31
Phillips Curve — Inflation-Unemployment Trade-off
The Phillips Curve, introduced by economist A.W. Phillips in 1958, describes an inverse relationship between the rate of inflation and the rate of unemployment in an economy. Based on empirical data from the UK (1861–1957), Phillips found that when unemployment was low, wage inflation was high, and vice versa.
Economic logic: When unemployment falls, workers gain bargaining power, wages rise, firms' costs increase, and prices rise — causing inflation. Conversely, high unemployment reduces wage pressure, keeping inflation low.
Short-run vs Long-run Phillips Curve:
- Short-run: The trade-off is valid — policymakers can choose a point on the curve, accepting higher inflation for lower unemployment.
- Long-run: Economists Friedman and Phelps (1968) argued the curve is vertical at the Natural Rate of Unemployment (NAIRU — Non-Accelerating Inflation Rate of Unemployment). In the long run, attempts to reduce unemployment below NAIRU only result in accelerating inflation, not sustained lower unemployment.
India's Challenge — Stagflation: India has periodically experienced stagflation — the simultaneous occurrence of high inflation and high unemployment (or low growth). The basic Phillips Curve cannot explain stagflation. Supply-side shocks (oil price rise, food supply disruption) can push both inflation and unemployment up simultaneously, as seen during the 1970s global oil crisis and India's 2022-23 inflation episode driven by Russia-Ukraine war supply disruptions. This makes simplistic Phillips Curve-based policy prescriptions inadequate for India's structural economic challenges.
---
Chapter 32
IMAGE GENERATION PROMPTS
`A high-resolution, realistic digital photograph of a busy Indian retail vegetable and grocery market, showing fresh agricultural produce alongside a digital price display scale. Warm natural lighting, 8k resolution, photorealistic quality.`
`A detailed realistic photo illustration of an economic analyst reviewing Consumer Price Index (CPI) and inflation line charts on multi-screen monitors inside a financial research firm in Mumbai. High detail, warm interior lighting, photorealistic.`
Prepare with RRBCONTENTS
Free mock tests, previous year papers, and daily current affairs for UPSC, SSC & Railway exams.
Start Free Mock Tests →Continue Reading
Explore More Articles
Knowledge Hub
More Blog Articles
In-depth articles on Polity, Economy, Environment and Current Affairs.
Study Material
Exam Study Notes
Subject-wise notes and digests for Railway, SSC, Banking and State PSC exams.
Current Affairs
Daily Current Affairs & GK
Daily updates and static GK bank with active-recall quizzes.