ISRO Monsoon Satellite Images: INSAT Tracks Weather
How INSAT-3DS, INSAT-3DR & MOSDAC Monitor Storm Clouds & Monsoon Troughs from 36,000 km
Home › Blog › Science & Technology › Space Science
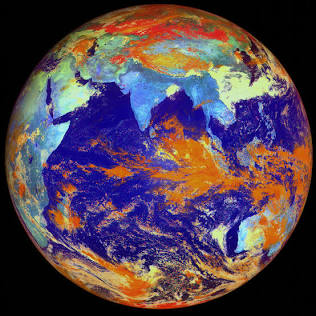
When monsoon clouds sweep across the Indian subcontinent, transforming parched agricultural landscapes into lush green expanses, scientists and citizens alike turn their eyes to the sky. But high above the atmosphere—positioned in geostationary orbit roughly 36,000 kilometers above the equator—it is ISRO's meteorological satellites that keep a constant, vigilant eye on Earth.
Search queries for "ISRO monsoon cloud satellite images," "INSAT-3DS live satellite map," and "MOSDAC IMD weather tracker" routinely surge during peak rainy seasons. High-resolution infrared, visible, and water-vapor imagery captured by Indian Space Research Organisation (ISRO) spacecraft provides crucial real-time data to meteorologists, disaster management authorities, farmers, and aviation operators across the nation.
India’s weather monitoring capabilities have undergone a massive technological revolution over the past four decades. The space-based weather monitoring program began under the multipurpose INSAT (Indian National Satellite System) framework, evolving into specialized meteorological platforms.
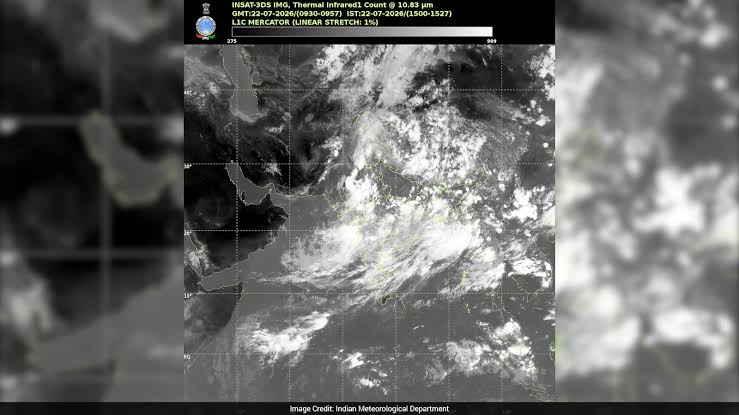
Launched in 2013 and 2016 respectively, INSAT-3D and INSAT-3DR established a new benchmark for Indian meteorology. Located at 82 degrees East and 74 degrees East orbital slots, these geostationary satellites provided continuous 15-minute imaging loops over the Indian Ocean Region (IOR).
Key instruments onboard INSAT-3D/3DR include:
On February 17, 2024, ISRO successfully launched INSAT-3DS onboard the GSLV-F14 rocket from the Satish Dhawan Space Centre in Sriharikota. Notably, this launch marked a historic victory for ISRO’s Geosynchronous Satellite Launch Vehicle (GSLV)—famously nicknamed the "Naughty Boy" due to its mixed past performance—achieving pinpoint orbital insertion.
Fully funded by the Ministry of Earth Sciences (MoES), INSAT-3DS acts as a primary continuity mission, reinforcing India's operational weather forecasting alongside the Indian Meteorological Department (IMD).
When looking at a live ISRO cloud map on portals like MOSDAC or IMD, the black-and-white or color-enhanced satellite images represent specific regions of the electromagnetic spectrum. Decoding these bands reveals critical meteorologic details:
What it measures: Thermal Infrared sensors detect heat radiation emitted by cloud tops and the Earth's surface.
How to interpret: Infrared imagery works day and night. Because higher altitudes in the troposphere are significantly colder, bright white areas indicate extremely cold cloud tops. Cold cloud tops correspond to tall, vertically developed Cumulonimbus clouds that produce heavy monsoon downpours and severe thunderstorms. Dark/Grey areas represent warm ground surfaces, low-level fog, or shallow Stratus clouds that carry less intense precipitation.
What it measures: Reflectivity (albedo) of sunlight off clouds and land surfaces.
How to interpret: Available only during daylight hours. Thick cloud masses reflect significant sunlight, appearing as brilliant, dense white patches. Thin, high-altitude Cirrus clouds appear semi-translucent grey.
What it measures: Radiation emitted by water vapor molecules in the middle-to-upper troposphere (between 4 km and 10 km altitude).
How to interpret: Bright, white, or colored regions highlight high mid-level atmospheric moisture—a key indicator of incoming monsoon surges, low-pressure systems, and tropical cyclones over the Bay of Bengal and Arabian Sea.
The Indian Southwest Monsoon (June to September) is driven by complex thermodynamic interactions between ocean surfaces, land masses, and tropospheric pressure winds. ISRO's satellite imagery allows meteorologists to observe macro-scale weather mechanisms in real time:
During summer in the Northern Hemisphere, intense solar heating over the Indian subcontinent and Tibetan Plateau creates a strong low-pressure zone. This draws the Inter-Tropical Convergence Zone (ITCZ)—a broad band of converging trade winds and cloud clusters—northward from the equator into the Indian mainland. INSAT satellite imagery tracks this shift as a continuous wave of heavy cloudiness migrating northward from the Indian Ocean.
As moist Arabian Sea winds strike the steep topographic barrier of the Western Ghats, air is forced upward (orographic lift), cooling rapidly and condensing into massive cloud banks. Thermal infrared images regularly capture dense, cold cloud shields hugging the Konkan, Goa, and Kerala coastlines while the rain-shadow region of eastern Maharashtra and Karnataka remains relatively clear.
A substantial portion of central India’s monsoon rainfall is generated by Low-Pressure Systems (LPS) forming over the Bay of Bengal. INSAT satellite animations track these systems as rotating spiral cloud masses that move inland across Odisha, West Bengal, Jharkhand, and Madhya Pradesh, bringing widespread regional rainfall.
For researchers, students, and severe weather trackers, ISRO provides free public access to raw and processed satellite data through dedicated web platforms:
| Satellite Mission | Orbital Slot / Type | Primary Imaging Instrument | Atmospheric Sounder | Major Application Areas |
|---|---|---|---|---|
| INSAT-3D | 82° East (Geostationary) | 6-Channel Multispectral Imager | 19-Channel Sounder | Cyclone tracking, cloud top temp, sea surface temperature (SST). |
| INSAT-3DR | 74° East (Geostationary) | 6-Channel Multispectral Imager | 19-Channel Sounder | Middle-infrared night-time fog estimation, snow cover mapping. |
| INSAT-3DS | Continuity Orbit (Geostationary) | Upgraded 6-Channel Imager | Enhanced 19-Channel Sounder | Next-gen climate monitoring, weather modeling, ocean studies. |
| Oceansat-3 (EOS-06) | Sun-Synchronous Polar Orbit | Ocean Color Monitor (OCM-3), Scatterometer | N/A | Ocean wind vectors, potential fishing zones (PFZ), coastal mapping. |
Understanding how ISRO's space capabilities intersect with climate research and public safety highlights key technological concepts:
A) 500 km
B) 2,000 km
C) 36,000 km
D) 100,000 km
Correct Answer: C
Explanation: Geostationary satellites like INSAT-3D, 3DR, and 3DS operate at an altitude of approximately 35,786 km (roughly 36,000 km) directly above the equator.
A) PSLV-C58
B) GSLV-F14
C) LVM3-M4
D) SSLV-D2
Correct Answer: B
Explanation: INSAT-3DS was successfully launched onboard the GSLV-F14 rocket from Sriharikota on February 17, 2024.
A) Warm low-level fog
B) Cold cloud tops associated with high-altitude storm clouds
C) Clear ocean surface waters
D) Dry desert ground
Correct Answer: B
Explanation: Infrared imagery measures cloud top temperatures. Colder, higher cloud tops appear bright white, indicating dense Cumulonimbus clouds.
A) Bhuvan
B) MOSDAC
C) Samarth
D) SWAYAM
Correct Answer: B
Explanation: MOSDAC (Meteorological & Oceanographic Satellite Data Archival Centre), managed by SAC Ahmedabad, hosts live INSAT weather data.
A) Ministry of Defense
B) Ministry of Agriculture
C) Ministry of Earth Sciences (MoES)
D) Ministry of Electronics and IT
Correct Answer: C
Explanation: INSAT-3DS is an exclusive continuity mission fully funded by the Ministry of Earth Sciences.
ISRO's INSAT-3D, 3DR, and 3DS geostationary satellites use multispectral imagers operating in Thermal Infrared (TIR), Visible (VIS), and Water Vapor (WV) channels to capture atmospheric radiation every 15 minutes, mapping cloud top height, temperature, and moisture levels.
INSAT-3D (launched 2013) introduced 19-channel atmospheric sounders. INSAT-3DR (launched 2016) added night-time fog tracking capabilities. INSAT-3DS (launched 2024 via GSLV-F14) is a next-generation continuity mission fully funded by the Ministry of Earth Sciences.
Live satellite imagery, 3D atmospheric loops, and rainfall estimates can be accessed on ISRO's MOSDAC portal (mosdac.gov.in) and the IMD Weather Dashboard.
Bright white spots in Thermal Infrared imagery indicate extremely cold cloud tops located high in the atmosphere, corresponding to dense Cumulonimbus storm clouds that bring heavy monsoon downpours.
Explore comprehensive learning guides, interactive quizzes, and daily updates on space exploration and meteorology.
Solve PYQs → Study Notes →Join our official Telegram community for daily updates: @rrbcontents