POVERTY AND UNEMPLOYMENT IN INDIA: CONCEPTS, MEASUREMENT COMMITTEES, MULTIDIMENSIONAL POVERTY INDEX & GOVERNMENT SCHEMES (COMPLETE GUIDANCE FOR COMPETITIVE EXAMS)
Chapter 1
INTRODUCTION
Poverty and unemployment are twin socioeconomic challenges that lie at the heart of economic development in India. While economic growth (GDP expansion) is a necessary condition for national progress, true development occurs only when growth is inclusive—creating productive employment opportunities and liberating millions of households from the clutches of income deprivation, malnutrition, and social marginalization.
In the words of Professor Amartya Sen (Nobel Laureate in Economics), poverty is not merely a lack of income; it is fundamentally a "capability deprivation"—the lack of basic freedom and opportunities to lead a dignified, healthy, and productive life.
Since Independence, India has made massive strides in reducing poverty. According to the NITI Aayog National Multidimensional Poverty Index (MPI) Report, over 13.5 crore (135 million) Indians successfully exited multidimensional poverty between 2015-16 and 2019-21. However, tackling structural unemployment, underemployment, disguised agricultural unemployment, and regional income disparities remains a top national priority.
For aspirants preparing for competitive examinations such as UPSC Civil Services (GS Paper III Economics & Social Issues), State Public Service Commissions (BPSC, UPPSC, MPPSC, RAS), SSC CGL, and Banking Exams, a thorough mastery of poverty estimation committees (Alagh, Lakdawala, Tendulkar, Rangarajan), NITI Aayog MPI indicators, unemployment types (Disguised, Structural, Frictional), PLFS survey metrics, and major flagships schemes (MGNREGA, DAY-NRLM, PM-KISAN, PM Vishwakarma) is essential.
This comprehensive master career guide provides an exhaustive breakdown of Poverty and Unemployment in India. We cover every economic detail—from absolute vs relative poverty and committee poverty line comparison tables to NITI Aayog 12 MPI indicators, labor force formulas, MGNREGA provisions, 12 exam-focused FAQs, and essential revision tools.
---
Chapter 2
CORE CONCEPTS OF POVERTY
CORE CONCEPTS OF POVERTY - Illustrative Reference
Core Categories of Poverty
├── 1. Absolute Poverty (Deprivation of basic minimum survival needs - Calorie/Consumption Basket)
└── 2. Relative Poverty (Income inequality compared to average living standards - Gini Coefficient)
Absolute poverty refers to a condition where a household's income or consumption expenditure falls below a fixed, minimum threshold line (Poverty Line) necessary to afford basic human physical survival needs—specifically minimum daily food calorie intake, shelter, clothing, clean drinking water, and basic healthcare.
- Calorie Norms in India (Y.K. Alagh Task Force 1979):
- Rural Areas: 2,400 Calories per person per day (higher calorie requirement due to heavy physical agricultural labor).
- Urban Areas: 2,100 Calories per person per day.
1. The Lorenz Curve: Graphical representation of the cumulative distribution of national income received by cumulative percentages of the population. The 45-degree diagonal line represents Line of Absolute Equality. The greater the distance between the actual Lorenz Curve and the 45-degree line, the higher the income inequality.
2. The Gini Coefficient: Mathematical ratio calculated as the area between the 45-degree Line of Equality and the Lorenz Curve, divided by the total area under the Line of Equality:
$$ ext{Gini Coefficient} =
rac{ ext{Area between Line of Equality and Lorenz Curve}}{ ext{Total Area under Line of Equality}}$$
- Gini Ratio Scale: Ranges from 0 (Perfect Equality) to 1 (Absolute Inequality).
Relative poverty measures income inequality within a society by comparing the income or standard of living of the bottom 20% of the population against the top 10% or average national income.
- Measurement Tools: Relative poverty and income inequality are measured using the Lorenz Curve and the Gini Coefficient (where $0$ represents perfect income equality and $1$ represents absolute inequality).
---
Chapter 3
HISTORICAL EVOLUTION OF POVERTY ESTIMATION COMMITTEES IN INDIA
Evolution of Poverty Estimation Committees
├── 1. Working Group (1962): First national poverty line (Rs 20 rural / Rs 25 urban per month)
├── 2. Y.K. Alagh Task Force (1979): Calorie-based norms (2400 rural / 2100 urban)
├── 3. Lakdawala Committee (1993): Linked rural to CPI-AL & urban to CPI-IW
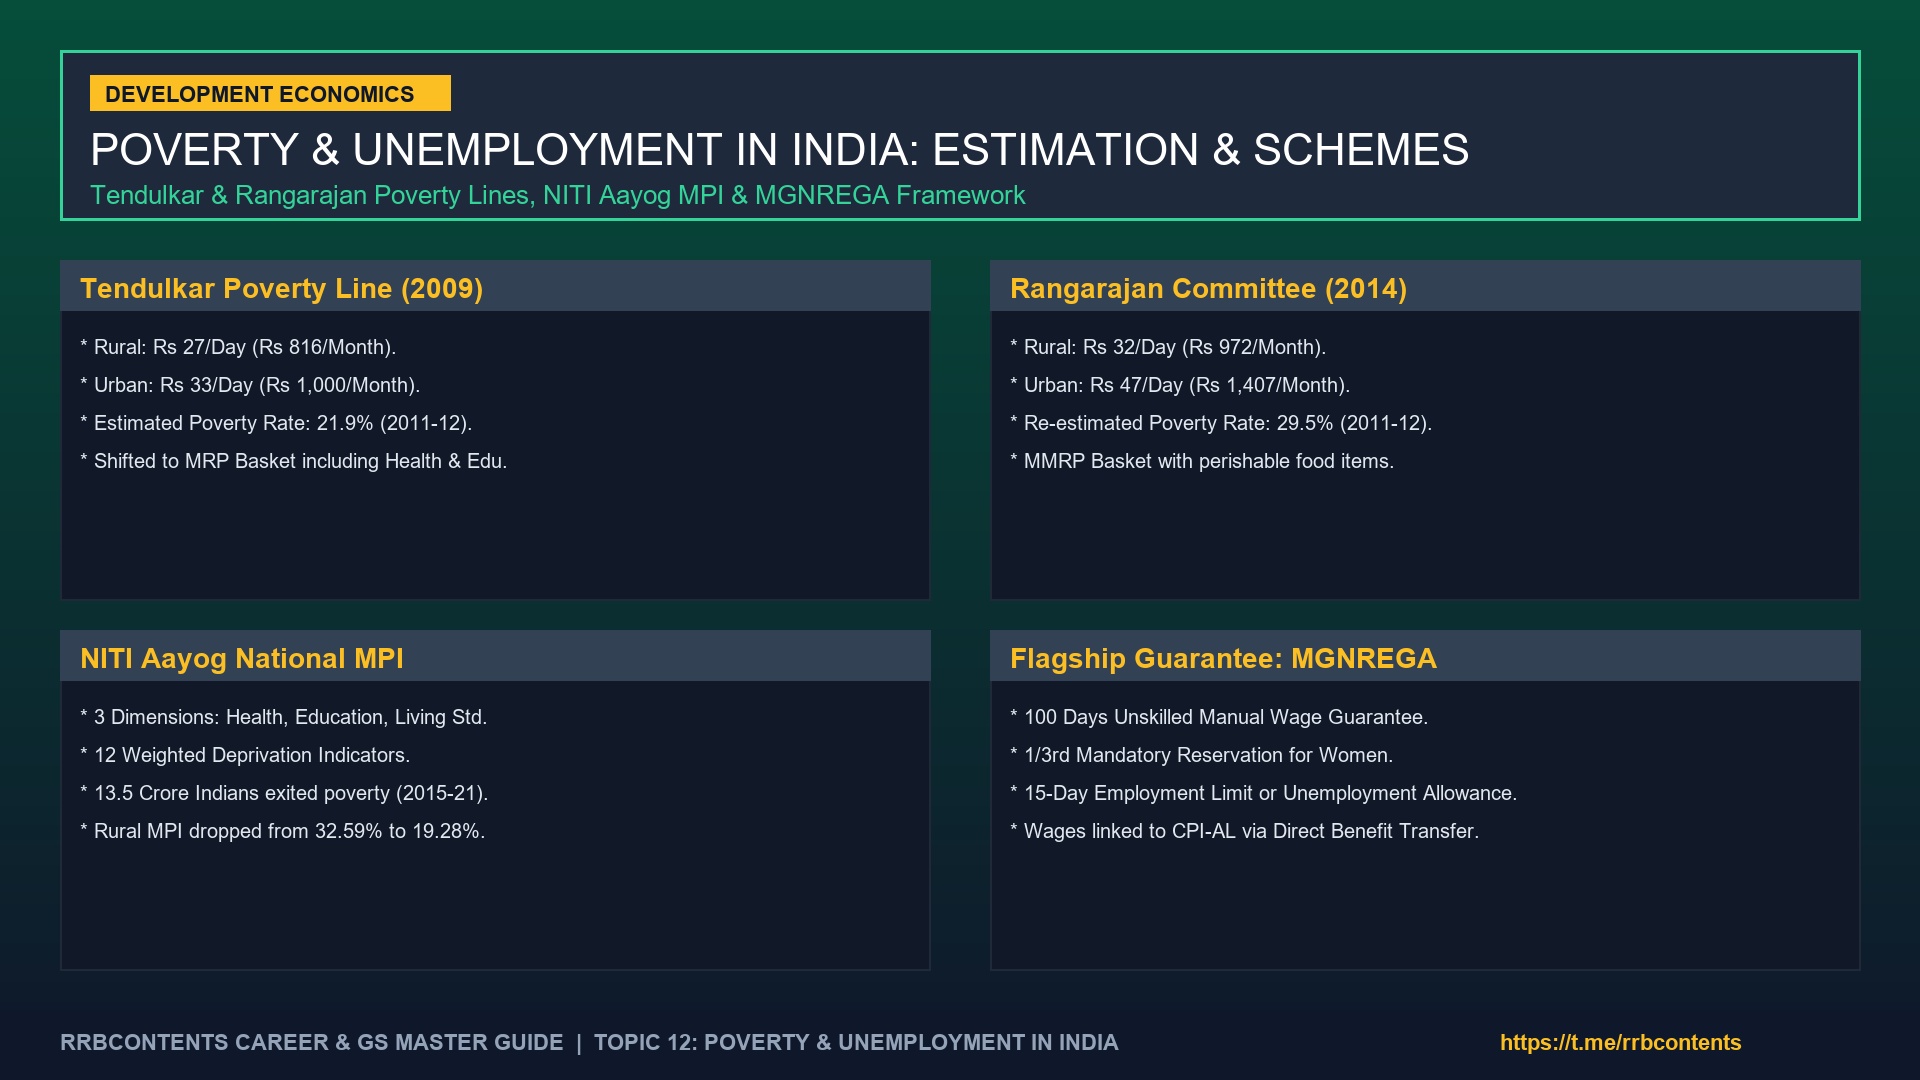
├── 4. Suresh Tendulkar Committee (2009): Shifted to health/education consumption basket (21.9% Poverty)
└── 5. C. Rangarajan Committee (2014): Revised basket (29.5% Poverty - Rs 32 rural / Rs 47 urban per day)
---
Chapter 4
COMPARATIVE ANALYSIS OF MAJOR POVERTY ESTIMATION COMMITTEES
| Committee Name | Year | Methodology & Reference Period | Rural Poverty Line | Urban Poverty Line | Estimated Poverty Rate (%) |
|---|---|---|---|---|---|
| Y.K. Alagh Task Force | 1979 | Calorie-based minimum (URP - 30 Day Reference) | 2,400 Calories/day | 2,100 Calories/day | ~54.9% (1973-74) |
| Lakdawala Committee | 1993 | Disaggregated State Poverty Lines via CPI-AL & CPI-IW | CPI-AL adjusted | CPI-IW adjusted | ~36.0% (1993-94) |
| Suresh Tendulkar | 2009 | MRP Basket (Included Private Health & Education spending) | ₹27 / Day (₹816 / Month) | ₹33 / Day (₹1,000 / Month) | 21.9% (2011-12) |
| C. Rangarajan | 2014 | MMRP Basket (Behavioral calorie + protein/fat + non-food) | ₹32 / Day (₹972 / Month) | ₹47 / Day (₹1,407 / Month) | 29.5% (2011-12) |
---
- Moved Beyond Calorie Intake: Recognized that calorie consumption alone does not reflect true poverty. Included private expenditure on education, health, electricity, and footwear.
- Mixed Reference Period (MRP): Used 365-day reference period for low-frequency items (clothing, footwear, durable goods) and 30-day reference period for food.
- Poverty Headcount Ratio (2011-12): Fixed national poverty rate at 21.9% (Rural poverty: 25.7%; Urban poverty: 13.7%).
- Modified Mixed Reference Period (MMRP): Used 7-day reference for perishable food (edible oil, eggs, fish, vegetables), 30-day for fuel/rent, and 365-day for clothing/education.
- Higher Poverty Line: Set rural line at ₹32/day and urban line at ₹47/day.
- Poverty Headcount Ratio (2011-12): Re-estimated national poverty at 29.5% (Rural: 30.9%; Urban: 26.4%).
---
- Health (1/3 Weight): Nutrition (1/6), Child & Adolescent Mortality (1/12), Maternal Health (1/12).
- Education (1/3 Weight): Years of Schooling (1/6), School Attendance (1/6).
- Standard of Living (1/3 Weight): Cooking Fuel (1/21), Sanitation (1/21), Drinking Water (1/21), Electricity (1/21), Housing (1/21), Assets (1/21), Bank Account (1/21). A household is classified as multidimensionally poor if its deprivation score equals or exceeds 33.33% (1/3rd) of the weighted indicators.
Chapter 5
NITI AAYOG NATIONAL MULTIDIMENSIONAL POVERTY INDEX (MPI)
Traditional income poverty lines fail to capture non-monetary deprivations suffered by households. In 2021, NITI Aayog launched India's first National Multidimensional Poverty Index (MPI), adapted from the global Oxford Poverty and Human Development Initiative (OPHI) and UNDP methodology.
NITI Aayog National MPI Structure (3 Dimensions & 12 Indicators)
├── 1. Health Dimension (Weight: 1/3)
│      ├── Indicator 1: Nutrition (1/6 weight)
│      ├── Indicator 2: Child & Adolescent Mortality (1/12 weight)
│      └── Indicator 3: Maternal Health (1/12 weight)
├── 2. Education Dimension (Weight: 1/3)
│      ├── Indicator 4: Years of Schooling (1/6 weight)
│      └── Indicator 5: School Attendance (1/6 weight)
└── 3. Standard of Living Dimension (Weight: 1/3)
       ├── Indicator 6: Cooking Fuel (1/21 weight)
       ├── Indicator 7: Sanitation (1/21 weight)
       ├── Indicator 8: Drinking Water (1/21 weight)
       ├── Indicator 9: Electricity (1/21 weight)
       ├── Indicator 10: Housing (1/21 weight)
       ├── Indicator 11: Assets (1/21 weight)
       └── Indicator 12: Bank Account (1/21 weight)
1. Massive Poverty Reduction: Multidimensional poverty in India declined from 24.85% in 2015-16 to 14.96% in 2019-21. Over 13.5 crore people escaped multidimensional poverty!
2. Fastest Decline in Rural Areas: Rural multidimensional poverty dropped steeply from 32.59% to 19.28%.
3. Top Performing States: Uttar Pradesh, Bihar, Madhya Pradesh, Odisha, and Rajasthan recorded the fastest absolute reduction in multidimensional poverty.
---
A critical macroeconomic challenge where GDP growth expands rapidly due to capital-intensive automation, digital services, and financial sectors without creating a corresponding expansion in manufacturing employment opportunities.
Chapter 6
UNEMPLOYMENT IN INDIA: CONCEPTS & TYPES
Types of Unemployment in India
├── 1. Disguised Unemployment (Marginal Productivity of Labor = ZERO) -> Prevalent in Agriculture
├── 2. Structural Unemployment (Skill Mismatch between job seekers & market demand)
├── 3. Cyclical Unemployment (Economic recession & trade cycle demand slump)
├── 4. Frictional Unemployment (Temporary gap while switching jobs)
├── 5. Seasonal Unemployment (Off-crop seasonal agricultural lull)
├── 6. Underemployment (High-skilled worker taking low-paying basic job)
└── 7. Open Unemployment (Willing worker completely idle without any work)
---
- Core Definition: A situation where more workers are engaged in a work than are actually required.
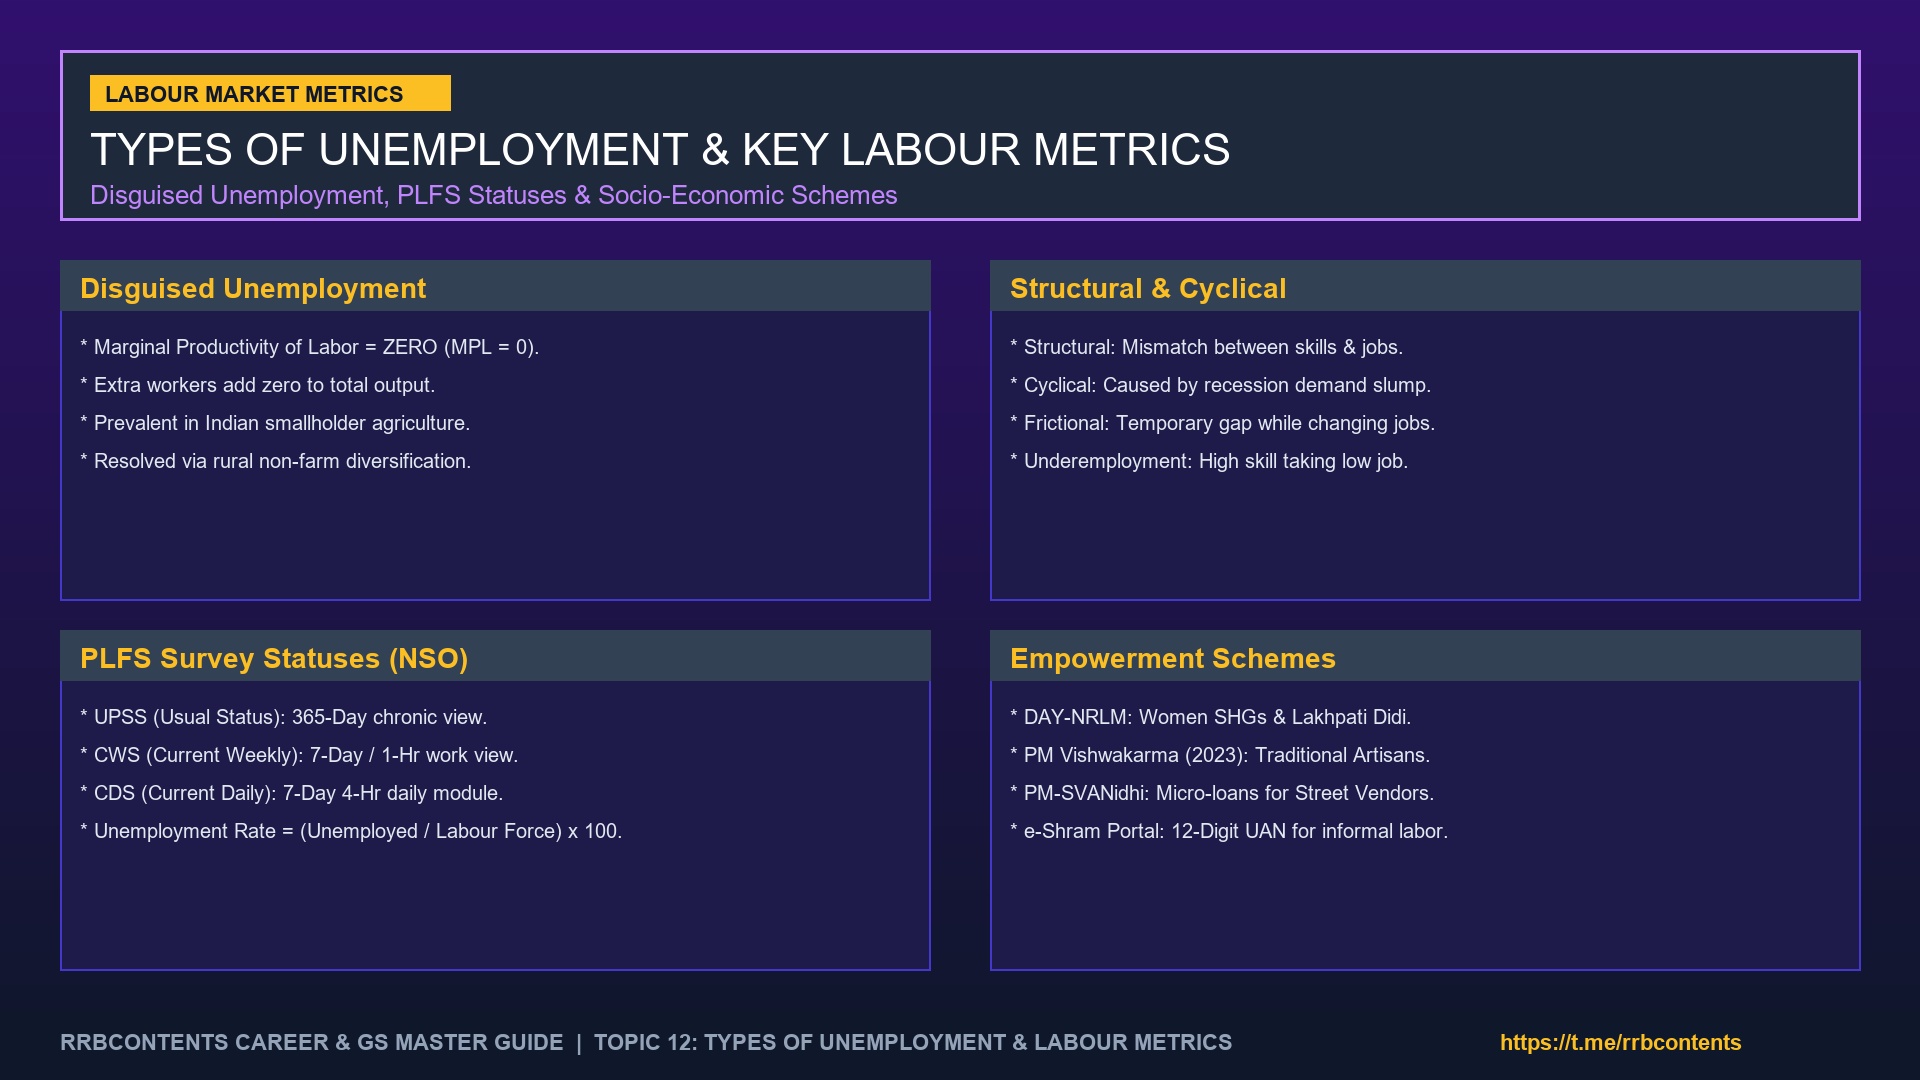
- Marginal Productivity ($\text{MP}_L$): The Marginal Productivity of Labor is ZERO ($\text{MP}_L = 0$). If some workers are withdrawn from the activity, total production does NOT decrease.
- Indian Context: Highly prevalent in Indian agriculture. For example, 6 family members working on a 1-acre farm where 2 workers are sufficient.
- Core Definition: Caused by a structural mismatch between the skills possessed by job seekers and the actual skills required by modern employers.
- Indian Context: Millions of college graduates lack industry-ready digital and technical skills despite available job vacancies in IT and manufacturing.
- Caused by periodic downturns in the business trade cycle (recession or demand slump). During economic recessions, aggregate demand falls, forcing firms to lay off workers.
- Temporary unemployment that occurs when a worker is in the process of moving from one job to another or searching for a better job match.
---
Chapter 7
MEASUREMENT METRICS: PERIODIC LABOUR FORCE SURVEY (PLFS)
In India, official labor force statistics are collected and published by the National Statistical Office (NSO) under the Periodic Labour Force Survey (PLFS) (launched in 2017).
Core Labour Force Formulas
├── Labour Force = Employed Persons + Unemployed Persons (Looking for work)
├── Labour Force Participation Rate (LFPR) = (Labour Force / Total Population) x 100
├── Worker Population Ratio (WPR) = (Employed Persons / Total Population) x 100
└── Unemployment Rate (UR) = (Unemployed Persons / Labour Force) x 100
1. Usual Principal and Subsidiary Status (UPSS):
- Reference Period: 365 Days prior to survey date.
- Measures chronic, long-term structural unemployment. An individual is considered employed if engaged in economic activity for a major part of the year (183+ days).
2. Current Weekly Status (CWS):
- Reference Period: 7 Days prior to survey date.
- An individual is considered employed if engaged in economic activity for at least 1 hour on any 1 day during the reference week.
3. Current Daily Status (CDS):
- Reference Period: 7 Days evaluated on a daily basis (in 4-hour modules).
- Most sensitive and comprehensive measure of short-term unemployment and underemployment.
---
- National Database of Unorganized Workers (NDUW): First comprehensive national database of unorganized workers (construction workers, migrant workers, gig and platform workers, street vendors, domestic workers).
- Universal Account Number (UAN): Enrolled workers receive a 12-digit e-Shram UAN card providing accidental death/disability insurance cover under PMSBY and seamless portability of social security benefits across states.
Chapter 8
MAJOR GOVERNMENT SCHEMES FOR POVERTY ALLEVIATION & EMPLOYMENT
Flagship Poverty Alleviation & Employment Schemes
├── 1. Rural Wage Guarantee: MGNREGA (2005) - 100 Days Legal Guarantee
├── 2. Rural Livelihoods: DAY-NRLM (Women Self-Help Groups & Micro-finance)
├── 3. Farmer Income Support: PM-KISAN (Rs 6,000 Annual Direct Benefit Transfer)
├── 4. Artisan Support: PM Vishwakarma Scheme (2023 - Holistic Craftspeople Aid)
├── 5. Street Vendor Credit: PM-SVANidhi (Collateral-free Micro-loans)
└── 6. Social Housing: PM Awas Yojana (PMAY-Gramin & PMAY-Urban)
---
1. Legal Guarantee: Guarantees at least 100 days of demand-driven unskilled manual wage employment in a financial year to every rural household whose adult members volunteer to do manual work.
2. Mandatory Women Reservation: At least one-third (33.33%) of beneficiaries MUST be women.
3. Unemployment Allowance: If the Gram Panchayat fails to provide employment within 15 days of receiving a job application, the applicant is legally entitled to a daily Unemployment Allowance.
4. Workplace Proximity: Work must be provided within a 5 km radius of the applicant's village. If work is beyond 5 km, an additional 10% transport allowance is paid.
5. Wage Linkage & Material Ratio: Wages are indexed to CPI for Agricultural Labourers (CPI-AL). Wages must be paid within 15 days via Direct Benefit Transfer (DBT). Material-to-labor ratio capped at 40:60.
---
- Launched: 2011 (rebranded as DAY-NRLM in 2015).
- Core Strategy: Mobilizes rural poor women into Self-Help Groups (SHGs), providing revolving funds, capital subsidies, and collateral-free bank loans up to ₹20 Lakhs to build sustainable micro-enterprises ("Lakhpati Didi" initiative).
---
- Objective: Provides holistic end-to-end support to traditional artisans and craftspeople (Vishwakarmas) working with hands and tools across 18 traditional trades (carpenters, blacksmiths, goldsmiths, cobblers, potters, weavers).
- Benefits: Official Vishwakarma Certificate & ID card, skill upgradation training, toolkit incentive of ₹15,000, and collateral-free credit support up to ₹3 Lakhs at a subsidized 5% interest rate.
---
1. Lakhpati Didi Initiative (Under DAY-NRLM):
- Objective: Empowers rural women members of Self-Help Groups (SHGs) to earn a sustainable annual household income of at least ₹1 Lakh.
- Target: Target of creating 3 Crore Lakhpati Didis across rural India.
- Support Architecture: Provides training in micro-enterprises, financial literacy, drone piloting for agriculture ("Namo Drone Didi"), livestock care, and digital payment mechanisms.
2. PM-SVANidhi (PM Street Vendor's AtmaNirbhar Nidhi):
- Launched: June 2020 by the Ministry of Housing and Urban Affairs (MoHUA).
- Micro-Credit Structure: Provides collateral-free working capital loans to urban street vendors:
- 1st Tranche: Collateral-free loan of ₹10,000 (repayable in 1 year).
- 2nd Tranche: Collateral-free loan of ₹20,000 upon timely repayment of 1st tranche.
- 3rd Tranche: Collateral-free loan of ₹50,000 upon timely repayment of 2nd tranche.
- Incentives: 7% interest subsidy per annum and cashback incentives for adopting digital UPI transactions.
- Objective: Direct income support scheme for farmer families.
- Financial Benefit: ₹6,000 per year transferred directly into bank accounts in three equal installments of ₹2,000 every 4 months.
---
- PMKVY 4.0 (Pradhan Mantri Kaushal Vikas Yojana): Implemented by the National Skill Development Corporation (NSDC), training youth in Industry 4.0 skills (AI, Robotics, Drones, 3D Printing, IoT, and Mechatronics).
- Deen Dayal Upadhyaya Grameen Koushalya Yojana (DDU-GKY): Specialized placement-linked skill development scheme for rural poor youth aged 15-35 years, guaranteeing at least 70% job placement for trained candidates in formal sector companies.
- Indira Gandhi National Old Age Pension Scheme (IGNOAPS): Monthly pension for BPL senior citizens aged 60+ years.
- Indira Gandhi National Widow Pension Scheme (IGNWPS): Monthly pension for BPL widows aged 40+ years.
- Indira Gandhi National Disability Pension Scheme (IGNDPS): Monthly pension for BPL persons with severe/multiple benchmark disabilities (80%+ disability).
Chapter 9
IMPORTANCE FOR COMPETITIVE EXAMS & QUICK REVISION
1. Poverty Lines: Tendulkar (2009): ₹27 rural / ₹33 urban per day (21.9% poverty); Rangarajan (2014): ₹32 rural / ₹47 urban per day (29.5% poverty).
2. NITI Aayog MPI: 3 Dimensions (Health, Education, Standard of Living) & 12 Indicators. 13.5 crore exited poverty.
3. Disguised Unemployment: Marginal Productivity of Labor is ZERO ($\text{MP}_L = 0$); typical in agriculture.
4. MGNREGA Secrets: 100 days legal guarantee; 1/3rd reserved for women; 15-day job provision limit; 5 km work distance; Social Audit by Gram Sabha.
---
Chapter 10
FREQUENTLY ASKED QUESTIONS (FAQS)
Chapter 11
# Q1: What is the main difference between Absolute Poverty and Relative Poverty?
Answer: Absolute Poverty measures severe deprivation below a fixed minimum survival line (Poverty Line). Relative Poverty measures income inequality in relation to the average income of society using the Gini Coefficient.
Chapter 12
# Q2: What were the daily poverty lines fixed by the Suresh Tendulkar Committee (2009)?
Answer: ₹27 per day in Rural areas (₹816/month) and ₹33 per day in Urban areas (₹1,000/month), estimating national poverty at 21.9% in 2011-12.
Chapter 13
# Q3: What were the daily poverty lines fixed by the C. Rangarajan Committee (2014)?
Answer: ₹32 per day in Rural areas (₹972/month) and ₹47 per day in Urban areas (₹1,407/month), re-estimating national poverty at 29.5% in 2011-12.
Answer: A situation where more workers are engaged in an activity than required, such that the Marginal Productivity of Labor is ZERO ($\text{MP}_L = 0$). Common in Indian agriculture.
Chapter 14
# Q5: How many dimensions and indicators are used in NITI Aayog's National Multidimensional Poverty Index (MPI)?
Answer: NITI Aayog's MPI uses 3 Dimensions (Health, Education, Standard of Living) across 12 Indicators.
Chapter 15
# Q6: What is the minimum wage employment guarantee under MGNREGA 2005?
Answer: MGNREGA guarantees at least 100 days of demand-driven unskilled manual wage employment per financial year to adult members of rural households.
Chapter 16
# Q7: What percentage of jobs are reserved for women under MGNREGA?
Answer: At least one-third (33.33%) of mandatory job allocations are legally reserved for women under MGNREGA.
Chapter 17
# Q8: What happens if work is not provided within 15 days under MGNREGA?
Answer: If employment is not provided within 15 days of applying, the applicant is legally entitled to a daily Unemployment Allowance paid by the State Government.
Answer: Unemployment caused by a long-term mismatch between the skills possessed by job seekers and the actual technical requirements of available jobs in the market.
Answer: $$\text{LFPR} = \left( \frac{\text{Labour Force}}{\text{Total Population}} \right) \times 100$$, where Labour Force includes both employed persons and unemployed persons actively seeking work.
Answer: A Central scheme offering holistic skill training, toolkit incentives (₹15,000), and collateral-free credit (up to ₹3 Lakhs) to traditional artisans and craftspeople across 18 trades.
Chapter 18
# Q12: Which survey publishes official employment and unemployment data in India?
Answer: The Periodic Labour Force Survey (PLFS), conducted and published by the National Statistical Office (NSO), MoSPI.
---
Answer: An initiative aiming to empower 3 Crore rural women SHG members to earn a sustainable annual income of at least ₹1 Lakh through micro-enterprises and skill training.
Chapter 19
# Q14: What are the loan tranches under the PM-SVANidhi scheme for street vendors?
Answer: Collateral-free loans of ₹10,000 (1st tranche), ₹20,000 (2nd tranche), and ₹50,000 (3rd tranche) upon timely repayments.
Answer: DDU-GKY mandates a minimum of 70% placement guarantee in formal sector jobs for trained rural youth.
Answer: e-Shram is a national database developed by the Ministry of Labour providing 12-digit Universal Account Number (UAN) cards and social security benefits to unorganized workers.
Chapter 20
# Q17: What does a Gini Coefficient of 0 and 1 represent?
Answer: A Gini Coefficient of 0 represents perfect income equality, while 1 represents absolute inequality (where one person holds all income).
- PMAY-Gramin: Financial assistance of ₹1.20 Lakh in plain areas and ₹1.30 Lakh in hilly/difficult areas provided via direct benefit transfer to homeless rural families for constructing 25 sq. meter pucca houses equipped with LPG connection (PM Ujjwala), toilet (Swachh Bharat), and drinking water (Jal Jeevan Mission).
- PMAY-Urban: Four vertical components (In-situ Slum Redevelopment, Credit Linked Subsidy Scheme CLSS, Affordable Housing in Partnership AHP, and Beneficiary Led Construction BLC).
Chapter 21
PLFS (PERIODIC LABOUR FORCE SURVEY) MEASUREMENT APPROACHES
The National Sample Survey Office (NSSO) under MoSPI measures employment/unemployment using three operational approaches:
| Approach | Reference Period | Definition |
|---|---|---|
| Usual Principal Status (UPS) | 365 days preceding survey | Activity on which person spent relatively long time during past year. |
| Usual Principal & Subsidiary Status (UPSS) | 365 days preceding survey | Includes subsidiary economic activity of at least 30 days during past year. |
| Current Weekly Status (CWS) | 7 days preceding survey | Person had work for at least 1 hour on any 1 day during past 7 days. |
---
Chapter 22
# Multidimensional Poverty Index (MPI) Dimensions:
Global and National MPI measure poverty across 3 equally weighted dimensions using 10-12 indicators:
1. Health: Child mortality, Nutrition.
2. Education: Years of schooling, School attendance.
3. Standard of Living: Cooking fuel, Sanitation, Drinking water, Electricity, Housing, Assets, Bank Account.
---
Chapter 23
# Disguised Unemployment in Agriculture:
- Situation where more people are engaged in a work than required; marginal productivity of extra labor is zero ($ ext{MP}_L = 0$).
- Highly prevalent in smallholder Indian agriculture where family members work on small fragmented farm plots due to lack of alternative non-farm employment.
---
Chapter 24
CONCLUSION
Poverty alleviation and employment creation remain the central pillars of India's social and economic policy. By moving beyond traditional income poverty lines to NITI Aayog's Multidimensional Poverty Index, enforcing legal wage guarantees under MGNREGA, building women-led micro-enterprises through DAY-NRLM, and providing artisan credit via PM Vishwakarma, India is executing a structural transition toward inclusive growth.
For competitive exam aspirants, mastering Tendulkar and Rangarajan committee methodologies, MPI indicators, unemployment classifications ($\text{MP}_L=0$), and MGNREGA statutory rules guarantees complete preparation for scoring top marks in Indian Economy and Social Issues.
👉 Official Career Portal: [https://rrbcontents.com](https://rrbcontents.com)
👉 Official Telegram Channel: [Join RRBCONTENTS Telegram (@rrbcontents)](https://t.me/rrbcontents)
---
Chapter 25
Official Poverty Lines — Timeline of Methodology Changes
One of the most contested areas in Indian economics is the definition and measurement of poverty. Different committees have used different criteria, leading to different poverty estimates. This timeline is critical for exams:
| Committee | Year | Criterion Used | Poverty Line (per capita) |
|---|---|---|---|
| Dandekar-Rath Committee | 1971 | Calorie norms: 2,250 kcal/day (rural), 2,100 kcal/day (urban) | First systematic approach to calorie-based poverty measurement in India |
| Task Force (Alagh Committee) | 1979 | Calorie + protein norms | Rural: 2,400 kcal/day; Urban: 2,100 kcal/day; Monetary equivalent at 1973-74 prices |
| Lakdawala Committee | 1993 | State-specific calorie norms; separate poverty lines for each state | Rural: Rs 49/month (1973-74 prices); Urban: Rs 57/month — widely used through 1990s |
| Tendulkar Committee | 2009 | Multi-dimensional approach — food, education, health, clothing, shelter | Rural: Rs 27/day (2011-12 prices); Urban: Rs 33/day — significant methodological shift from pure calorie-based |
| Rangarajan Committee | 2014 | Higher calorie norms + explicit non-food spending; recommended higher thresholds | Rural: Rs 32/day; Urban: Rs 47/day — Gave higher poverty estimates than Tendulkar |
Key insight for exams: The Tendulkar Committee's methodology gave India's poverty headcount at 21.9% in 2011-12. The Rangarajan Committee's higher threshold would have given approximately 29.5% in 2011-12 — illustrating how methodology choices dramatically affect reported poverty rates. No official poverty line has been released since Rangarajan (2014), creating a data gap.
---
Chapter 26
Types of Unemployment in India — Key Classification
Understanding different types of unemployment is critical for answering questions in RRB NTPC Economics sections, UPSC GS III, and State PSC exams. Different types require different policy responses:
| Type of Unemployment | Definition | India-Specific Example |
|---|---|---|
| Structural Unemployment | Permanent mismatch between workers' skills and available jobs due to technological change or economic restructuring | IT professionals displaced by automation; handloom weavers unable to transition to factory jobs |
| Cyclical Unemployment | Caused by downturns in the business cycle when aggregate demand falls | Mass job losses during COVID-19 pandemic (2020); manufacturing slowdown in 2019 |
| Frictional Unemployment | Temporary unemployment during the transition period between jobs; exists even in a healthy economy | Fresh engineering graduate searching for first job; worker switching careers |
| Seasonal Unemployment | Work is available only during certain seasons of the year | Agricultural laborers without work during non-sowing/non-harvest months; construction workers in rainy season |
| Disguised Unemployment | Person appears to be employed but their marginal productivity is effectively zero — removing them would not reduce output | 5 family members working on a farm that could be managed by 2; common in Indian agriculture |
| Open Unemployment | Person is completely without work and actively seeking employment | Urban educated youth seeking jobs; visible and measurable in labor surveys |
| Underemployment | Person is employed but working fewer hours than desired, or in a job below their skill level | MBA working as a delivery executive; part-time worker seeking full-time employment |
NSSO/PLFS Measurement Methods:
- Usual Status (US): Based on majority of reference year — gives lowest unemployment rates
- Current Weekly Status (CWS): Based on reference week — intermediate estimate
- Current Daily Status (CDS): Based on each day of reference week — gives highest unemployment estimate; best for measuring underemployment
CMIE (Centre for Monitoring Indian Economy) provides monthly real-time unemployment data — urban unemployment rate (2023-24) hovering around 8-9%, rural at 5-6%.
---
Chapter 27
MNREGA — Detailed Data Points
The Mahatma Gandhi National Rural Employment Guarantee Act (MNREGA), 2005 is India's largest rural employment programme and a legally-backed social safety net. It is important to know the precise legislative and operational details for exams:
Legislative background: Enacted as Act No. 42 of 2005; came into force from 2 February 2006, piloted initially in 200 most backward districts including Anantapur, Andhra Pradesh. Extended to all rural districts of India by April 2008.
Core guarantee: Any adult member of a rural household willing to do unskilled manual work is entitled to 100 days of guaranteed employment per household per year at the applicable statutory minimum wage rate.
Financial and operational provisions:
- Wage payment timeline: Wages must be paid within 15 days of completion of work. If delayed beyond 15 days, workers are entitled to compensation at the rate of 0.05% of unpaid wages per day of delay under Section 25 of MNREGA.
- Unemployment Allowance: If work is not provided within 15 days of application, workers are entitled to an unemployment allowance — 1/4th of wage rate for first 30 days and 1/2 of wage rate thereafter. This allowance is paid by the State Government (not Centre).
- Women's participation mandate: Minimum 33% of workers employed under MNREGA must be women. In practice, women's participation has been higher — averaging 54-58% in recent years.
- Work location: Work must be provided within 5 km of the worker's habitation. If work is provided beyond 5 km, workers are entitled to an additional 10% of wages as transportation and living expenses.
- Work types: Permissible works include water conservation, drought proofing, flood management, micro-irrigation, rural connectivity, renovation of traditional water bodies, land development.
Financial data (exam-important):
- Budget allocation 2023-24: Rs 60,000 crore
- Budget allocation 2024-25: Rs 86,000 crore (revised upward amid rural distress)
- Persondays generated 2023-24: approximately 230 crore persondays
- Average wage rate 2023-24: approximately Rs 237/day (national average; varies by state)
- States like Kerala, Haryana pay higher MNREGA wages than national minimum
---
Chapter 28
Global Poverty Indices — India's Status (Current Affairs)
Multiple international indices measure India's poverty and hunger situation. These are frequently referenced in UPSC essays, GS III answers, and competitive exam current affairs sections:
Global Hunger Index (GHI) 2023:
India ranked 111 out of 125 countries — placed in the 'Serious' hunger category. The GHI is computed jointly by Concern Worldwide (Ireland) and Welthungerhilfe (Germany) using four indicators: undernourishment, child stunting, child wasting, and child mortality. The Indian government has consistently disputed the GHI methodology, arguing that the undernourishment estimate (based on a Food and Agriculture Organization opinion poll of 3,000 people) is unscientific and underestimates India's food security progress. India's child stunting rate has fallen from 38.4% (2015) to 35.5% (2022), and child wasting from 15.1% to 19.3% (worryingly increased).
Multidimensional Poverty Index (MPI) 2023 — UNDP and OPHI:
Prepare with RRBCONTENTS
Free mock tests, previous year papers, and daily current affairs for UPSC, SSC & Railway exams.
Start Free Mock Tests →Continue Reading
Explore More Articles
Knowledge Hub
More Blog Articles
In-depth articles on Polity, Economy, Environment and Current Affairs.
Study Material
Exam Study Notes
Subject-wise notes and digests for Railway, SSC, Banking and State PSC exams.
Current Affairs
Daily Current Affairs & GK
Daily updates and static GK bank with active-recall quizzes.