Home › Blog › Science & Technology › NISAR Satellite Antarctica Image
Why NISAR Satellite Antarctica Images Are Trending: Unlocking the Secrets of Frozen Earth
Track active recruitment notifications for ISRO Scientist/Engineer, Scientific Assistant & Govt exam updates on RRBCONTENTS Jobs Portal.
Key Takeaways & Mission Highlights
- Viral Science Breakthrough: High-definition radar maps of Antarctica captured by the joint NASA-ISRO Synthetic Aperture Radar (NISAR) satellite have gone viral worldwide.
- All-Weather 24/7 Vision: Microwave radar pulses pierce through dense polar storm clouds and 6 months of continuous winter darkness.
- Millimeter-Level Grounding Line Precision: Tracks the exact boundary where Antarctic glaciers transition from bedrock to ocean water, giving early warnings for global sea-level rise.
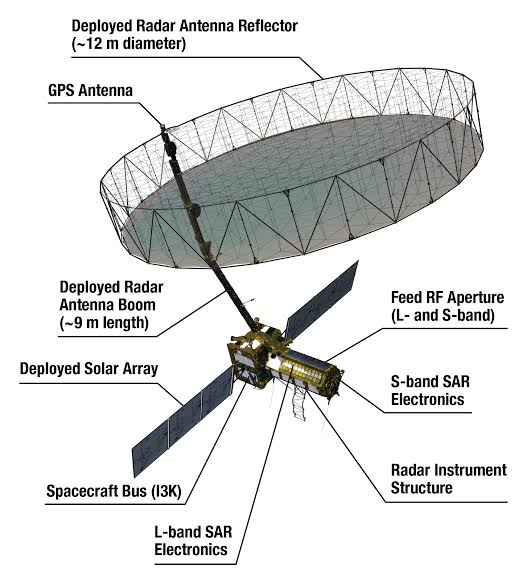
- First Dual-Frequency SAR: Combines NASA’s L-band (24 cm) and ISRO’s S-band (9.3 cm) radar with a massive 12-meter deployable reflector antenna.
Table of Contents
1. Why Are NISAR’s Antarctica Images Trending Right Now?
Stunning radar images of Antarctica captured by the joint NASA-ISRO Synthetic Aperture Radar (NISAR) satellite mission have taken social media, scientific forums, and news feeds by storm. Space enthusiasts, climate researchers, and competitive exam aspirants are searching for "NISAR satellite Antarctica image" to understand why these black-and-white and color-coded radar maps are generating so much global excitement.
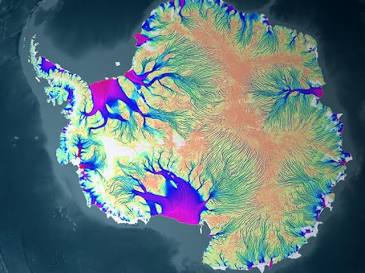
Unlike typical camera snapshots taken from space, these imagery datasets reveal what is happening on—and beneath—the frozen surface of Antarctica in unprecedented detail. By piercing through thick polar storm clouds and six months of continuous winter darkness, NISAR's dual-frequency radar system offers humanity a front-row seat to the rapid dynamics of the world's largest ice sheet.
For students preparing for competitive exams like UPSC Civil Services (GS Paper 1: Physical Geography, GS Paper 3: Science & Technology and Environment), State PSCs, SSC CGL, and Railway Recruitment Board (RRB) tests, as well as general readers, this guide breaks down why these images are trending, how the technology works, and why this mission is a historic milestone for India's space program.
A. Revealing Hidden Antarctic Glacier Motion
Traditional optical satellites rely on sunlight to capture images of Earth. During the Antarctic winter, when the continent is shrouded in complete darkness for months, optical sensors are virtually blind. Furthermore, dense storm clouds frequently block the view of key coastal glaciers.
NISAR solves this problem completely. Using active radar signals, it "illuminates" the ground below with microwave pulses. The newly released imagery shows high-resolution velocity maps of fast-flowing glaciers, such as the Pine Island and Thwaites Glaciers in West Antarctica. Viewers can visibly see ice streams moving toward the ocean, color-coded by velocity, transforming complex glaciological data into striking visual maps.
B. Tracking "Grounding Lines" with Millimeter Accuracy
One of the most critical reasons climate scientists are celebrating these images is NISAR's ability to locate glacier grounding lines—the precise boundary where a glacier transitions from resting on solid bedrock to floating on seawater.
When ocean temperatures rise, warm seawater creeps underneath floating ice shelves, pushing the grounding line further inland and accelerating glacier collapse. NISAR’s radar interferometry can detect vertical land and ice shifts down to the millimeter level, giving scientists an early-warning system for sea-level rise.
C. A Milestone for Bilateral Space Cooperation
For India, the release of these high-definition radar maps is a moment of national pride. NISAR represents the most expensive and technologically complex earth-observation satellite mission ever built jointly by ISRO (Indian Space Research Organisation) and NASA (National Aeronautics and Space Administration). Seeing Indian S-band radar hardware perform flawlessly over Earth's extreme polar environments marks a giant leap for indigenous space engineering.
2. What Is NISAR? Understanding the Satellite Mission
To understand the science behind the imagery, let's examine the core structure and objectives of the NISAR satellite.
A. Mission Overview
- Full Name: NASA-ISRO Synthetic Aperture Radar.
- Primary Objective: Map the entire globe (land and ice-covered surfaces) every 12 days to monitor ecosystem changes, ice-sheet collapses, natural hazards (earthquakes, tsunamis, landslides, volcanoes), and groundwater levels.
- Orbit: Sun-synchronous low-Earth orbit (LEO) at an altitude of approximately 747 kilometers.
- Designed Mission Life: Minimum 3 years.
B. The Dual-Frequency Radar Advantage
NISAR is the world's first satellite mission to use two different radar frequencies on a single platform:
- L-band SAR (24 cm wavelength): Built by NASA’s Jet Propulsion Laboratory (JPL). The longer L-band microwave pulses penetrate dense forest canopies, deep snowpack, and thick glacier ice, revealing structural details beneath the surface.
- S-band SAR (9.3 cm wavelength): Built by ISRO’s Space Applications Centre (SAC) in Ahmedabad. The shorter S-band radar is optimized for monitoring crop health, soil moisture, coastal mapping, and fine surface roughness.
When combined with a massive 12-meter deployable mesh reflector antenna, NISAR captures sweeping 240-kilometer-wide radar swaths at high spatial resolution.
3. Why Antarctica Monitoring Matters for India and the World
It is easy to wonder why a satellite mission co-funded by India is spending so much operational time imaging the South Pole. The answer lies in global climate linkages that directly affect the Indian subcontinent.
| Linkage Stage | Climate Impact Pathway |
|---|---|
| Stage 1 | Antarctic Glacier Melting (Thwaites & West Antarctic Ice Sheet). |
| Stage 2 | Global Sea Level Rise (~3.3 mm/year current baseline). |
| Stage 3 | Coastal Inundation along India's 7,516 km Coastline (Mumbai, Chennai, Kochi, Kolkata, Sundarbans). |
| Stage 4 | Disruption of Indian Ocean Monsoonal Circulation & Marine Ecosystems. |
A. Impact on Indian Coastal Infrastructure
Antarctica holds roughly 70% of the Earth's freshwater locked in its ice sheet. If the West Antarctic Ice Sheet were to collapse entirely, global sea levels would rise by over 3 meters.
For India, with a densely populated 7,516-kilometer coastline, even a modest sea-level rise poses catastrophic risks to mega-cities like Mumbai, Chennai, Kochi, and Kolkata, as well as low-lying delta regions in Bengal and Odisha. NISAR's precise tracking allows Indian disaster management authorities to model future coastal erosion and plan resilient infrastructure.
B. Supporting Indian Antarctic Research Stations
India maintains an active polar research presence in Antarctica through the National Centre for Polar and Ocean Research (NCPOR) under the Ministry of Earth Sciences. India currently operates two operational research stations in Antarctica:
- Maitri (established in 1989 in the Schirmacher Oasis).
- Bharati (established in 2012 in the Larsemann Hills).
High-resolution NISAR radar imagery provides real-time ice navigation maps for Indian supply ships, helping expedition teams navigate dangerous sea-ice channels safely during seasonal supply runs.
4. Technical Comparison: NISAR vs. Traditional Optical Satellites
| Feature / Parameter | Traditional Optical Satellites (e.g., Landsat, Sentinel-2) | NISAR (Synthetic Aperture Radar) |
|---|---|---|
| Primary Energy Source | Passive sunlight reflected off Earth | Active microwave radar pulses emitted by satellite |
| Day/Night Capability | Day-time only | 24/7 (Works in complete polar darkness) |
| Weather Dependency | Blocked by clouds, fog, and smoke | Penetrates clouds, fog, and atmospheric haze |
| Surface Penetration | Sees only top surface / canopy | Penetrates dry snow, ice layers, and vegetation |
| Measurement Precision | Meter-scale visual changes | Millimeter-scale surface deformation (Interferometry) |
| Re-visit Capability | Variable depending on cloud cover | Guaranteed 12-day global repeat cycle |
5. Exam Corner: High-Yield Insights for Competitive Exams
For students preparing for UPSC CSE, SSC CGL, RRB NTPC, and State PSCs, this trending topic connects directly to several core syllabus subjects:
A. Science & Technology (UPSC GS-3 / SSC)
- Synthetic Aperture Radar (SAR): A technique that uses the relative motion of the satellite over a target area to simulate a much larger physical antenna, producing high-resolution radar imagery.
- Interferometric SAR (InSAR): Combines two or more radar images of the same area taken at different times to measure tiny surface shifts (ground displacement, earthquake fault line slips, or glacier drift).
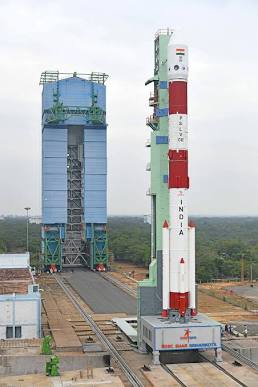
- ISRO Launch Vehicles: NISAR was launched aboard ISRO's GSLV-F16 (Mk II) from Satish Dhawan Space Centre, Sriharikota, on 30 July 2025, and has been operational for about a year.
B. Environment & Geography (UPSC GS-1 & GS-3)
- Glacier Grounding Line: The line marking the transition between grounded ice sheet and floating ice shelf.
- Cryosphere: The frozen water part of the Earth system (glaciers, ice caps, sea ice, permafrost).
- India's Polar Missions: Arctic (Himadri Station in Svalbard, Norway) and Antarctica (Dakshin Gangotri [abandoned], Maitri, and Bharati).
Interactive Science & Tech Quiz
Q1. Which two space agencies jointly developed the NISAR satellite mission?
A) ISRO and ESA
B) NASA and ISRO
C) NASA and JAXA
D) Roscosmos and ISRO
Correct Answer: B
Explanation: NISAR is a joint Earth-observation satellite mission developed by NASA and ISRO.
Q2. What is the wavelength band provided by ISRO for the NISAR satellite?
A) L-band (24 cm)
B) S-band (9.3 cm)
C) C-band (5.6 cm)
D) X-band (3 cm)
Correct Answer: B
Explanation: ISRO’s Space Applications Centre (SAC) built the S-band SAR payload, while NASA JPL built the L-band payload.
Prepare for Science & Technology Current Affairs
Explore free study notes, satellite mission breakdowns, and competitive exam materials on RRBCONTENTS.
Solve Science PYQs → Check Science Jobs →Join our official Telegram community: @rrbcontents